

We needed an environment that was less about collecting as much data as possible and more about manipulating that data into something readable by human beings and that’s what we found in InnerTrends.

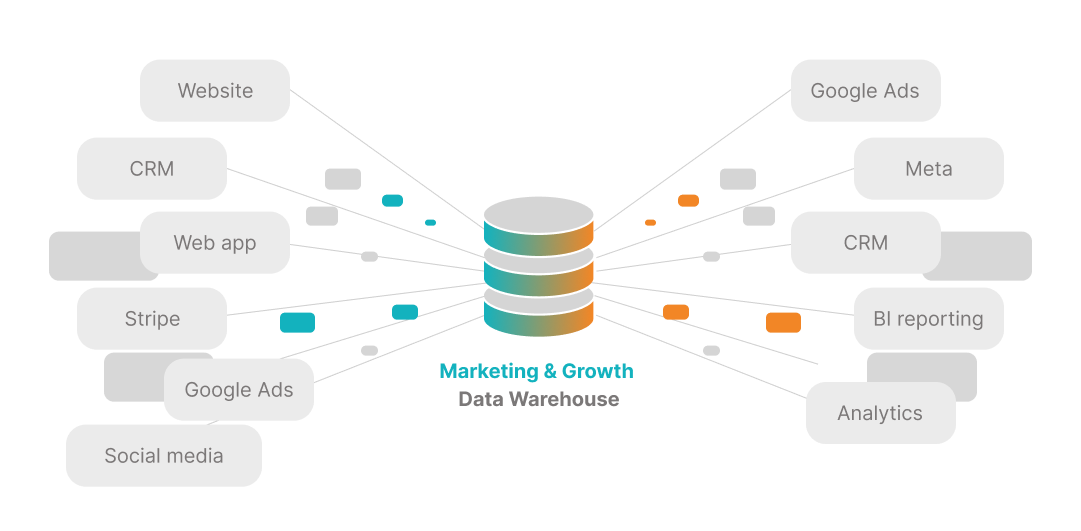
InnerTrends gave us a clear framework to track, measure, and interpret the entire onboarding funnel. By unifying customer journey data and surfacing actionable insights, the data deep dive analyses provided by InnerTrends helped the team understand not just where users were coming from but also why certain paths converted better.

InnerTrends is our go-to solution for understanding the performance of our business and making data-driven growth decisions. There's no substitute for the confidence that comes from understanding the story behind our data.

I highly appreciate the team's thoroughness when understanding our business needs, their responsiveness whenever we need clarifications or updates to our reports, and their pro-activeness to signal any anomalies within our data.

