
Understand the product metrics that matter to accurately find optimization opportunities within your product and improve retention.
What if we challenged you to look at product metrics in a different way?
We’re not saying that KPIs like daily active users (DAU) or monthly active users (MAU) are totally overrated; they still have their place, but the ultimate goal of a product analytics tool is not just to track product metrics, but rather, to understand your product and users well enough to provide optimization insights. Remember that the ultimate goal is to have more satisfied customers that you retain longer.
Before measuring product success, you need to ensure that you’ve got your customer journey and metrics definitions right. Although it sounds trivial, many companies either don’t have the correct definitions, or are not aligned on them across departments.
At InnerTrends, we look at metrics in a different way. We split metrics into two buckets:
- Universal metrics
- Contextual metrics
An example of a universal metric is your website conversion rate or your renewal rate. Contextual metrics arise when you describe something that could look different from one company to another, or the underlying definition is different.
Contextual product metrics – how do you track them and why?
Below, we’ll show you how we look at contextual metrics. Let’s start by examining the activation stage of the AARRR Pirate Metrics.
Onboarding starts from the moment a person creates an account, and is completed when the customer has experienced the promise of your product for the first time. The promise of your product is the value that can be realized by the customer as a result of using your product or service.
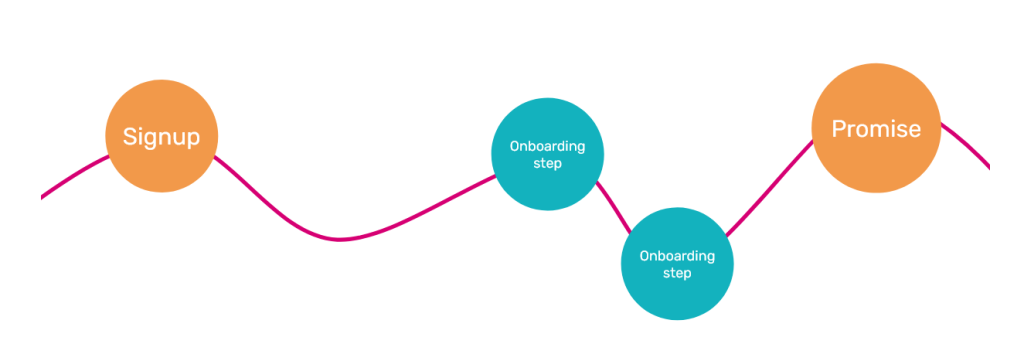
The onboarding process also includes “technical” requirements that users need to complete to experience the value of your product (or your product’s promise). E.g. adding subscribers before sending an email campaign).
Let’s start.
You first need to understand:
How many users or accounts have started onboarding, and how many have finished it.
But then you need to dig deeper into the data. You need to analyze the onboarding time, how accounts convert or drop off during the onboarding process, and what influences their behavior.
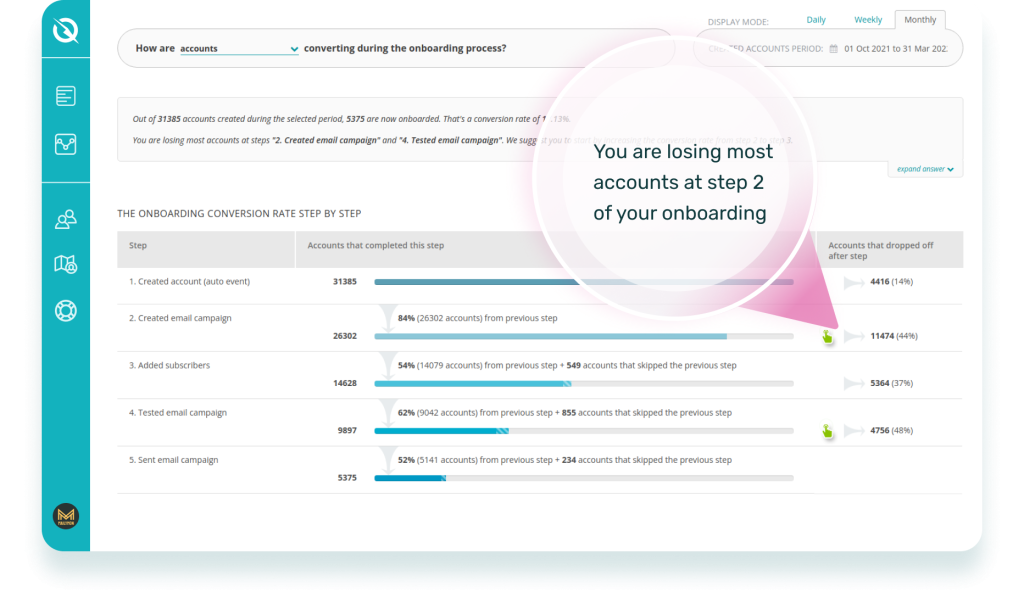
For this, you can start with this InnerTrends pre-built product analytics report:
How are accounts converting during onboarding?
It clarifies if you have a top or bottom of the funnel problem. It also quickly highlights what onboarding step you should focus on fixing.
Examples of contextual metrics:
- Onboarding conversion rate.
- Funnel drop off rate at each step of the onboarding process.
Always analyze metrics within a context. For example, check the onboarding rate by traffic source. If there’s a significant difference between organic and paid traffic, look at the expectations you are setting through ads. A high onboarding rate from organic traffic and a low onboarding rate from paid traffic indicate that your ads are over-selling, or your messaging isn’t right.
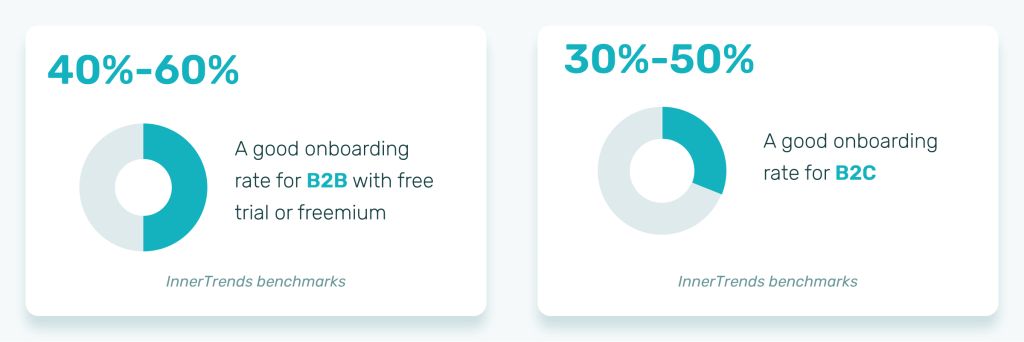
While the context of your business and the evolution of your metrics are crucial, here are some benchmarks from InnerTrends’ data since everyone wants to have a reference point:
Next, I check:
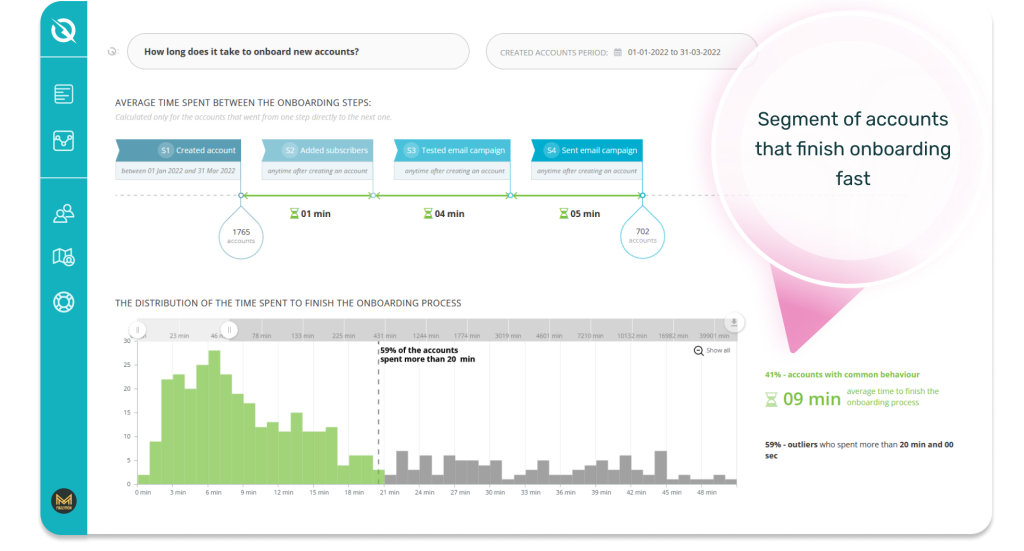
How long does it take to finish onboarding?
This report also shows the time spent at the onboarding step that I’ve just learned users get stuck on.
I even drill down into the segment of users that finished onboarding fastest. Quite often, people complete onboarding in a different way than was intended. I want to understand the differences since this is a successful segment.
Examples of contextual metrics:
- Average onboarding time for common behavior (e.g. segment of accounts that finish onboarding fast, without outliers).
- Onboarding time for each step.
I then go to:
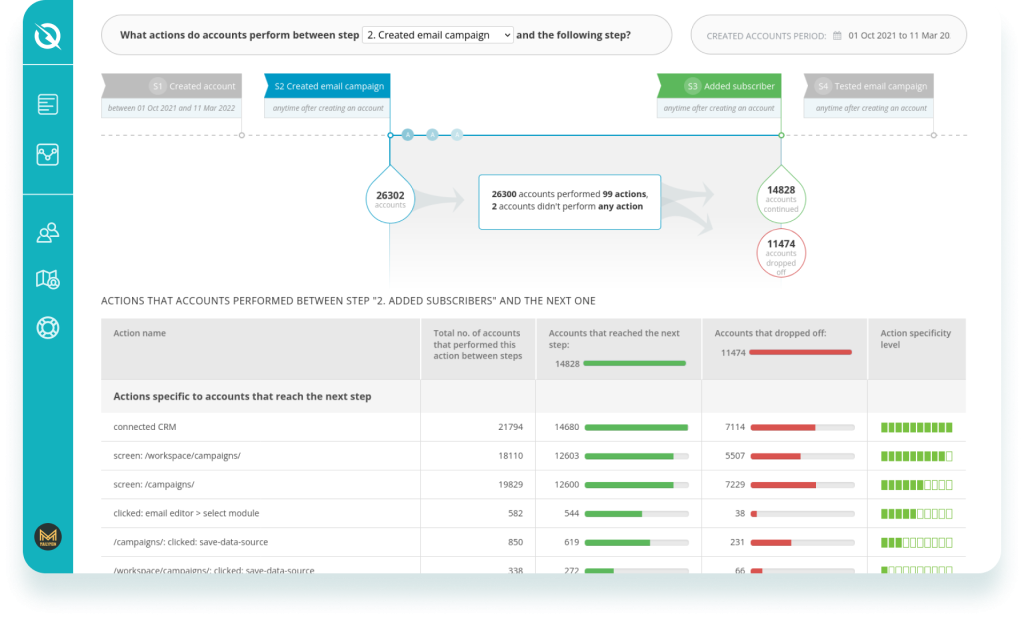
What actions do accounts perform between onboarding steps?
This report shows me actions specific to people who reach the next step and actions specific to people who abandon.
The first measure I take to fix issues is introducing an in-app product guide to point users towards the actions that are specific to successful users (I’ve just learned that!). I also put automatic emails in place to target the users likely to drop off at this step.
Examples of contextual metrics:
- Number of accounts that reach onboarding steps by doing specific actions.
- Number of accounts that drop off at onboarding steps by doing specific actions.
Connected to this last point, I review:
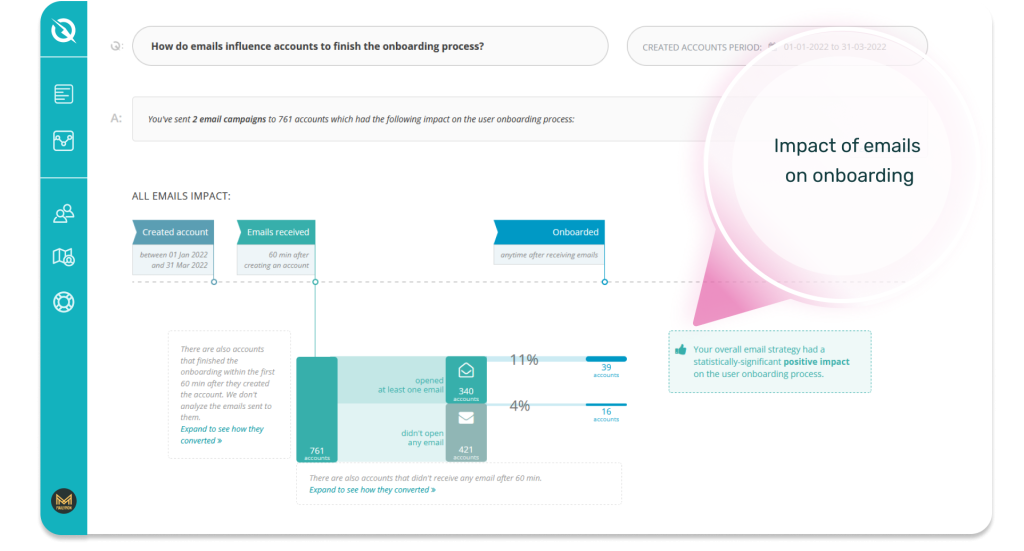
How are emails influencing accounts to finish the onboarding process?
I want to make sure that every email I send has a positive influence – users who open the emails convert better than those who don’t.
Examples of contextual metrics:
- The onboarding conversion rate of accounts that opened a specific email.
- The onboarding conversion rate of accounts that did not open a specific email.
The key element of contextual metrics is that they will most accurately help you find your optimization opportunities. So always analyze your metrics within a context.
Universal product metrics examples
The following are some examples of the classic metrics that everyone is familiar with. They’re useful in the context of start-ups looking for investors or reporting – but be careful not to fall in the trap of vanity metrics, or tracking metrics purely for the sake of tracking.
Always ask yourself – what does this metric mean for us, and what do we do with it?
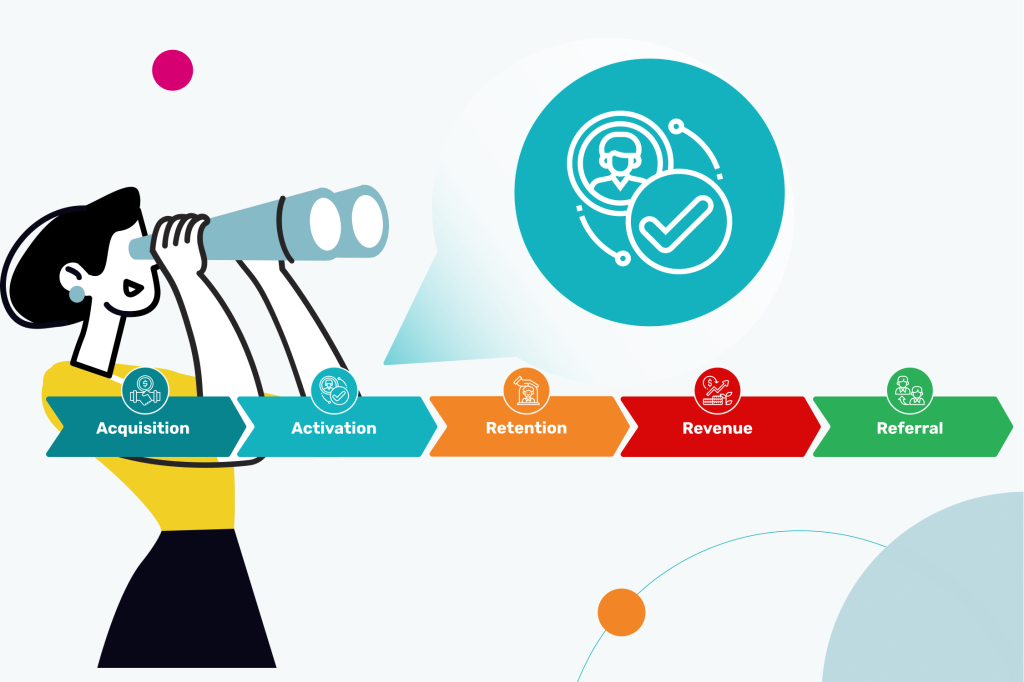
Acquisition:
- Signup conversion rate (+ comment: drill down by traffic source paid vs non-paid)
- Customer Acquisition Cost (CAC)
- Qualified Marketing Traffic
- Leads by Lifecycle Stage
- Lead-to-Customer Rate
Activation:
- Onboarding rate
- Trial to paid conversion rate
Retention:
- DAU, WAU, MOW + report between them
- Retention rate
- Customer Churn rate
- Customer Health Score
- Net Promoter scores (NPS)
Revenue:
- Free trial to paid conversion rate
- Subscription renewal rates
- MRR/ ARR
- Revenue churn rate
- Customer Lifetime Value (LTV or CLV)
- Months to Recover CAC
- CAC:LTV Ratio
Referral:
- Virality factor
What about the famous North Star Metric, you will ask? Or the Customer Engagement Score that SaaS companies so seek? I don’t consider either of them to be universal metrics. Especially the NSM has a different definition for each business, so I bucket it under “contextual.”
I promise more content on contextual metrics on this blog – subscribe to the InnerTrends DataDiary on this page and stay tuned for more!