Step 5 of 5 on how to double your SaaS revenue using the rule of 72.
We promised to share 5 steps from our example customer journey below on how you could double your revenue by improving five key SaaS conversion rate metrics by a mere 15%. Hard to believe but we are on the final step!
Those conversion rate metrics once again are:
|
Overview: Getting Started with the Rule of 72 for Doubling your SaaS Revenue |
| Step 1: Visits – From Stranger to Visitor |
| Step 2: Creates Account – From Visitor to Sign-up |
| Step 3: Get Onboarded – From Sign-up to Onboarded User |
| Step 4: First Week Retention After Onboarded – From Onboarded User to Returning to the Product within 1 Week |
| Step 5: Upgrade to a Paid Account – From First Week Retention After Onboarded to Paying Customer |
The rule of 72 is how you determine how long it would take to double your revenue ordinarily. But, by manipulating these conversion rates by 15% each with various growth strategies, you can do it faster and easier.
In this post, we’re addressing the final step, Step 5 – increasing your conversion rate by 15% from First Week Retention After Onboarded to Upgraded to a Paid Account.
Let’s Start by Understanding Timing
Do you know how long it takes for your users to upgrade to a paid account?
Let’s analyze a company that has a 30-Day trial period.
If you start with how many days, hours or minutes it takes your users to upgrade after creating their account then you can confidently know when to smartly trigger marketing activities to help the upgrade go smoothly.
In InnerTrends we have a quick report that lets us know this by answering:
How long does it take for accounts to reach the upgraded to paid goal?
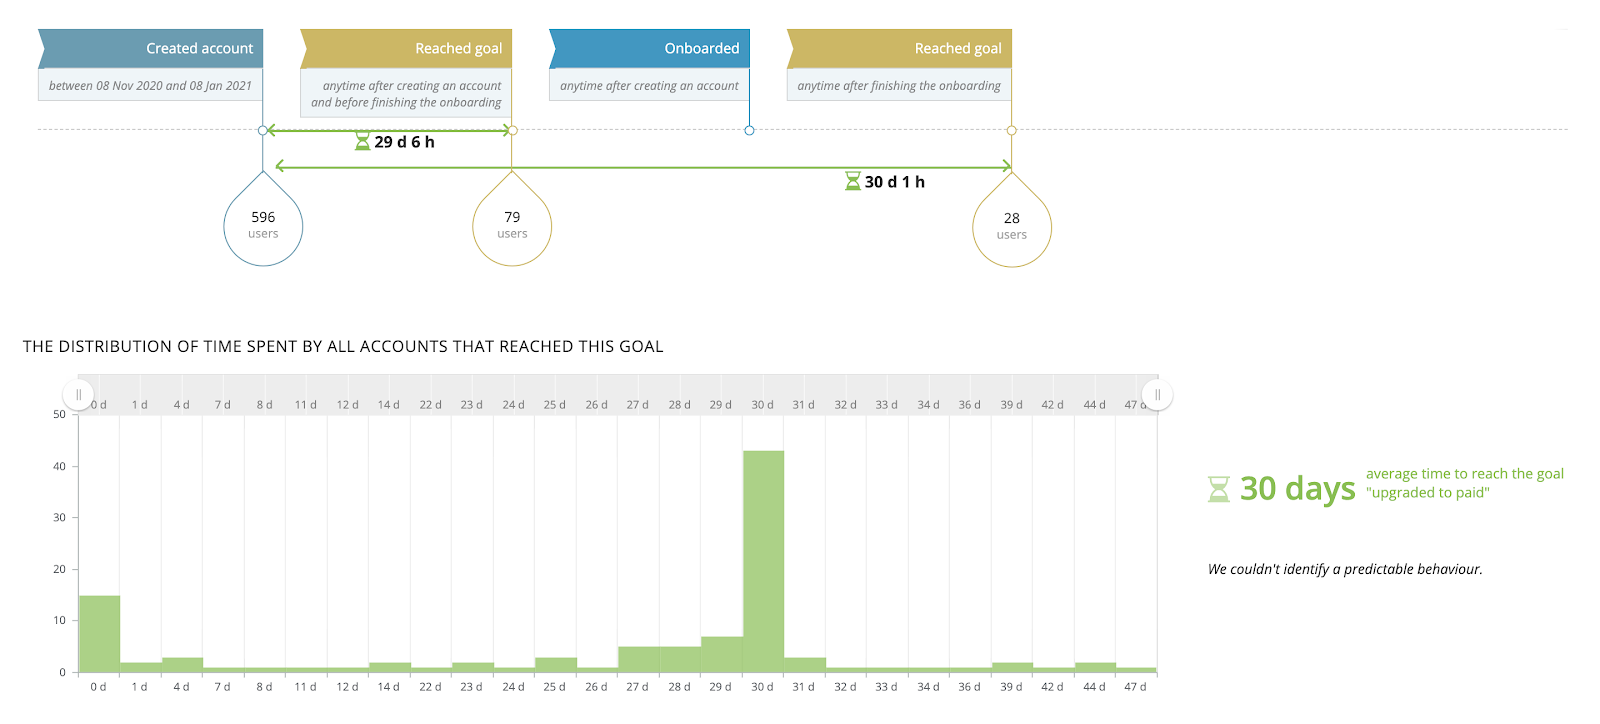
With a report like the one above we can now see that on average it takes 30 days for an account to reach upgraded to paid, makes sense right?
Note: If you have a trial period this doesn’t always map exactly to your trial period length but oftentimes it is close.
The Time Gap from Onboarded to Upgraded to a Paid Account
Next we need to know the amount of time we have to work with in order to optimize this final step’s conversion rate.
We need to know three bits of information, and we already know 2 of them:
- Time it takes on average to become Onboarded (Unknown)
- First week retention after onboarded (7 days after Onboarded)
- Time it takes to Upgrade to a Paid Account (30 days)
Looks like we just need to know how long it takes for users to become Onboarded. We talked about this a bit in Step 3 where we talk about Improving User Onboarding but mostly concentrating on the time it takes to reach each primary onboarding step in order to achieve Onboarded status.
For this analysis we need to concentrate on the average time it takes accounts to reach the last step, or complete onboarding.
In InnerTrends the report looks like this:
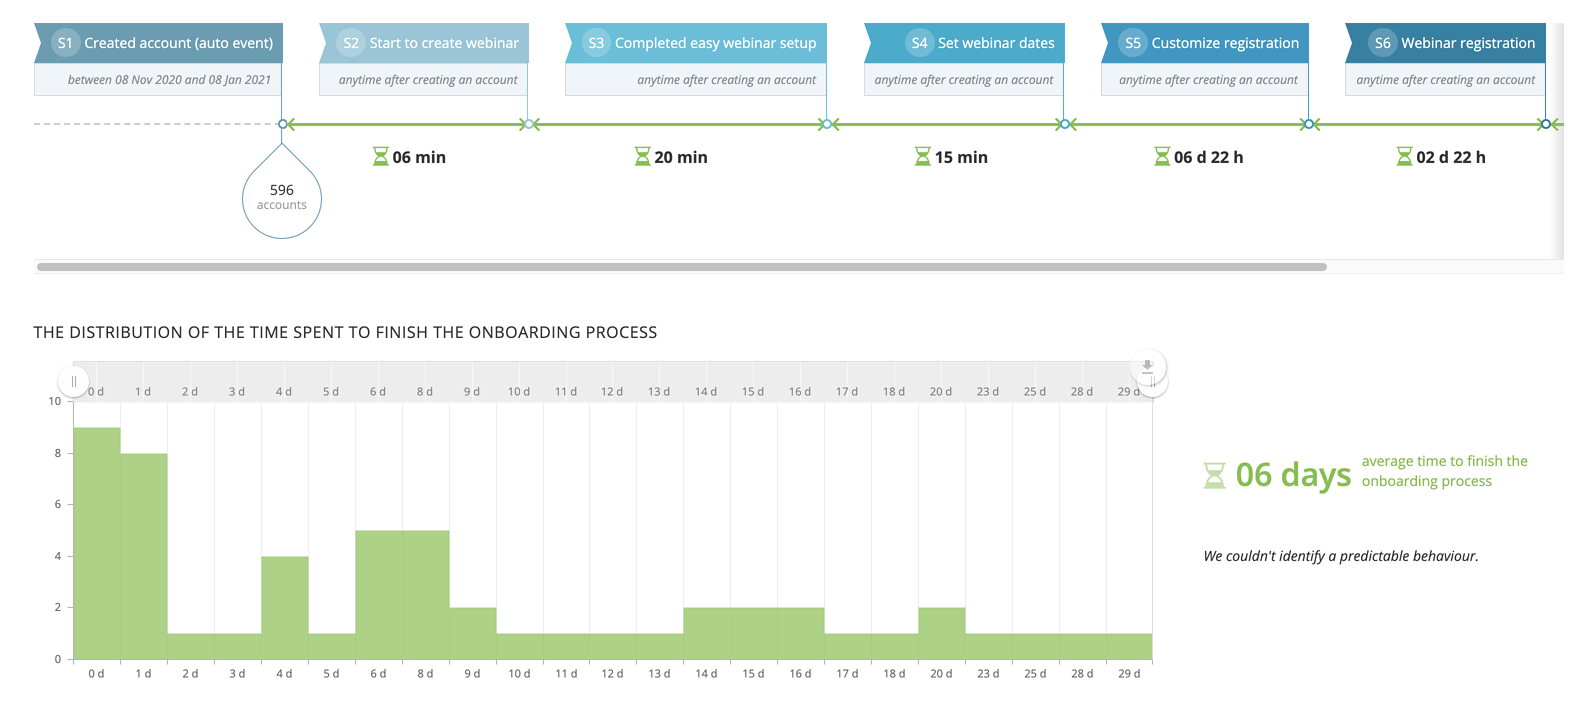
We can see in the bottom right of the image that it takes about 6 days to reach the last step in the Onboarding process.
We now have a big picture of what we need to analyze:
- Achieve Onboarded: 6 Days
- First Week Retention After Onboarded: 7 Days
6 + 7 = 13 Days Total
- Average Days to Upgrade to a Paid Account: 30 Days
If we take the 30-Day average and subtract 13 days to achieve first week retention after onboarded we are left with 16. So, with this information we know we need to optimize from day 16 to 30 within our example trial period in order to improve our First Week Retention after Onboarded to Upgraded to a Paid Account.
Back to Common Conversion Activity
You should already know your common conversion activity from our last post on improving first week retention rate, but let’s reiterate that a bit.
It comes into play nicely once you know how long it takes for accounts to upgrade to a paid account as well.
We need to answer one question that can be difficult to answer.
What are the differences in actions between onboarded accounts that return and those that churn (activity churn, not revenue or customer churn)?
Additionally we need to analyze the accounts with activity in the first 7 days (first week retention) after Onboarded but also return to the product after 14 days after Onboarded.
This period will look at the common conversion activity that brings accounts back to your product from the 7th day after account creation (after onboarded on day 6 on average) through the 31st day and should cover the period we are looking to analyze.
This is a pretty complex algorithm but we have this report out of the box in InnerTrends. It looks like this:
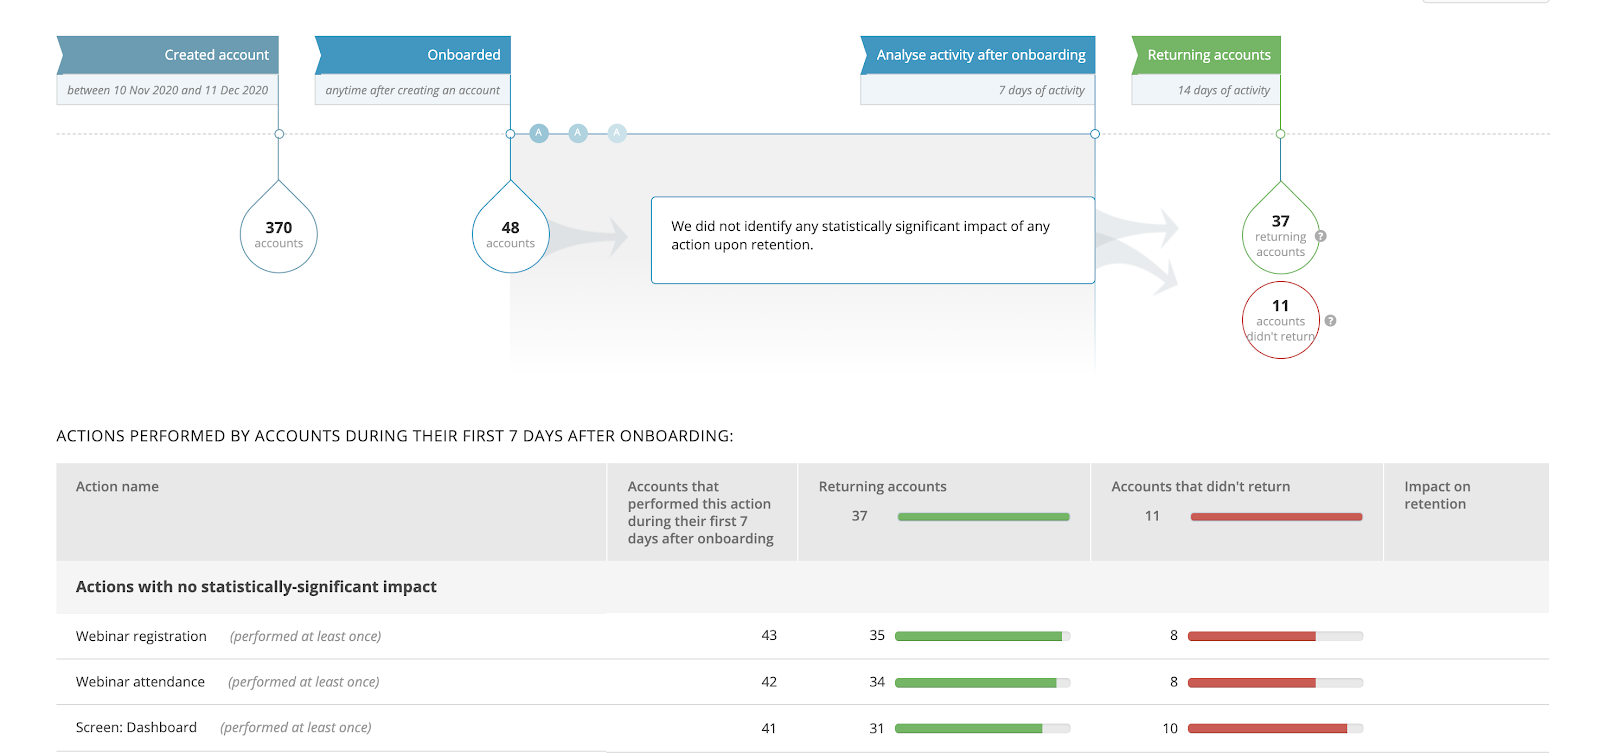
By analyzing the actions performed that create a positive impact on bringing the accounts back to the product, we can start to understand the areas of the product that matter most to accounts at this stage of discovery within your product.
However, if we want to optimize the conversion rate from First Week Retention after Onboarded to Upgraded to a Paid Account we need to also understand what specific events or actions lead accounts to churn (activity churn), or not return to the product in this time period.
By knowing this we can begin to try to keep users from experiencing negative actions in the product and reach out accounts in a timely manner to promote using the positive impact areas of our product.
That is some deep analysis, but extremely powerful!
Initiating Timely Contact
By leveraging strategic marketing techniques you can help users go through the actions that are very likely to help them make up their mind.
For instance, you can send them:
- Emails to experience a part of the product they have yet to see
- Walkthroughts or in-app messages to help them explore more once they click your email
- A reminder if they have initiated an order but haven’t finished checking out
- You can offer them certain benefits if they finish the purchase process
- Experiment with offering a timely discount
- An email giving them the option to pay using alternative payment methods
The types of marketing activities you can put in place to have higher conversion rates are endless once you know the what and when around how your accounts are using your product in positive and negative ways during this stage of optimization.
Make Paying You Easy
Another thing worth mentioning that might stop potential accounts from buying your product could be related to various technical issues surrounding paying such as credit or debit card issues, or to the payment method used on the site.
For example, if an app does not use Paypal as a payment method and clients don’t want to risk using their credit cards directly, the transaction is abandoned.
There are cultural differences between various nationalities to be aware of as well. For instance, Germans generally aren’t comfortable providing too much information during the checkout process, so having the exact same payment procedure for them and for Americans isn’t an efficient strategy.
Switching payment providers within your platform is often not an easy feat, but using new payment providers in your email campaigns is much easier. Based on the results you get from such implementations you can take a data-driven decision on which provider works best for your business.
I have encountered many cases when the simple switch from one payment provider to another did the trick and the company managed to reach its target of 15% increase in their conversion rate.
Strategic SaaS Pricing Updates
One other important area to consider is your pricing. Sometimes your biggest blocker is complicated pricing or areas surrounding price points etc.
There are many resources available on optimizing your SaaS Pricing Model but here are a few basics to consider.
Understand Your Value Levers
Rather than carte blanche up your prices by 15%, take another look at your pricing value levers. Do your value levers align with the goals of your users or are they only focused on benefiting your bank account?
Update Your Tiers
Take another look at all of your pricing tiers. Do you know your price elasticity and how they align with your ideal customers? You may find out that the lower tier is too high or that you can distribute a price increase between the top tier tiers. Or, if you are selling contracts, find unmet needs and opportunities to increase prices for more higher-demand services.
Address User Anxiety
You may be familiar with the theory of the 4-forces why consumers switch. The most important of these forces is often the most overlooked on pricing pages, Anxiety. Anxiety is an anticipatory fear that tells people NOT to try the new solution because (A) it might not actually help us or (B) once we buy into the solution, it won’t hold up its end of the bargain, ie. support will suck, there won’t be any improvements etc. Or the user is simply Anxious about their own ability to take full advantage of the investment, for example, accounting software or video editing tools, where there’s quite a bit of expertise needed just to walk through the front door.
Wrapping Up
It’s hard to believe, but in just 5 posts, we’ve addressed each of the conversion rates that can directly result in SaaS growth to Double Your Revenue using the Rule of 72.
But we’re not done yet. We want you to have our playbook that you can reference any time you want to improve your bottom line.
Get the Complete eBook on How To Double Your Software Revenue
While we’ve covered a lot in this post, believe it or not, we’ve barely scratched the surface of things you can do to double revenue in your SaaS company. We invite you to download the complete eBook to get insights on the rest of the steps for doubling the revenue of your business