
If you think acquiring a customer is the end of the finish line, then you might lose out on 67% of your additional revenue. That’s how much loyal customers can add to your business.
For it to be a reality for your business, you’ll have to crack how loyalty translates into the digital world and how you can measure it objectively.
Users have limited resources, especially attention, and they are willing to give that to the products that show returns on their investment.
That’s why measuring user engagement is necessary to understand your customer’s interest in your product and drive revenue further.
In this article, we’ll determine what user engagement means, how to quantify and make sense of it, and what to do to boost revenue and customer loyalty.
What is User Engagement?
User engagement is an indicator of your customer’s interaction with your product. It’s a catch-all term to measure how much value they get from your product.
User engagement metrics help you get better insights into your customer’s expectations and how they feel about your product so that you can bridge the gap between the two.
Based on what user engagement means for your business, you can use different metrics to measure it.
Why is it Critical to Measure User Engagement?
Reduce churn and maintain healthy cash flow.
Customer churn isn’t unusual and certainly not unpredictable.
The secret is to identify the difference between your active and engaged users.
Users subscribe to your product because they expect positive results from it. So when they aren’t engaging with your product, it’s a red flag highlighting that something in your product isn’t working for them. You can’t rely on users for a steady cash flow if they are just sitting there in the system with no purpose.
Measuring engagement helps you track such dormant users and take the necessary actions to prevent the dreaded churn.
Generate revenue through upselling.
89% of businesses said they prioritize acquiring new customers as a growth strategy.
What about those who already trust your product and can give more returns at a much lesser cost?
User engagement metrics track the user’s interaction with your product throughout their journey so that you can nudge them in the right direction with the right message and at the right time.
For example – if a customer’s usage of a particular feature has increased recently, the obvious next step should be to incline them for an upgrade plan or upsell an additional service.
Plan a (better) roadmap for your product.
You might have built a great product, but user engagement metrics can give critical insights into whether customers also believe it or not.
Measuring engagement informs you of which features are a hit or a miss among your users, and what to do to provide better solutions.
When you plan your product development in sync with your customer’s requirements, you can aim for an engaged community of users. It also helps you optimize your resources and efforts.
Optimize your sales and marketing strategies.
How much do you spend each month generating leads and acquiring new clients?
And are the results justifying the expenses?
If not, then you might be missing your ideal prospects. User engagement metrics can help you identify the right market to go after for maximum reach and sales.
You can analyze your existing customer’s usage patterns to find a suitable target market for your services.
Improve customer loyalty.
Product + Services = Successful Business
Focusing on the customer journey and leveraging relevant key engagement metrics at each touchpoint can boost customer loyalty. See how some of the top companies are strategizing to achieve the same.
And nothing’s better than customers who turn into brand advocates and get you more business through referrals.
Top 5 Metrics Related to User Engagement and How to Measure Them
1. Active Users & Stickiness
What does it mean?
The active users metric varies depending on how you define this. Generally, people who log in to the product at least once a day are daily active users (DAU), and those who do the same in a month are monthly active users (MAU).
To check how many of your total users honestly qualify as active, you can use the following checklist:
- The frequency and duration of login sessions
- The features being used
- The recent product suggestions or feedback submitted
- The issues they’ve highlighted
How to calculate it?
It is the easiest metric to calculate when monitoring engagement and product stickiness.
You can use daily and monthly active users for calculating product stickiness.
Stickiness = (Daily Active Users / Monthly Active Users) X 100
2. Activity Churn Rate
What does it mean?
Activity Churn denotes the users who have stopped using your product or services. It can directly impact your revenue, and more acquisitions or upsells are needed to compensate.
How to calculate it?
You can calculate the activity churn rate on a monthly and annual basis.
Churn Rate % = (Number of users who stopped using your product / Total number of active users at the start of a period) X 100
For example, if your business had 1000 active users at the beginning of the month and 50 users stopped using your product by the end of the month, you would divide 50 by 1000. The answer is 5%.
3. Feature Usage
What does it mean?
Every product looks capable and has a long list of features. But the products that shine stand the test of their users.
Your existing features should add value to your user’s business, and the upcoming features should align with your user’s requirements rather than being one more addition to the list.
The customer’s usage pattern is a great way to understand what works best for your customers.
How to calculate it?
Feature usage is represented by how many of your active users have any interaction with your feature, and when you drill down in it, what are the individual actions they do inside the feature.
Feature usage = (Number of unique users of feature / Total number of unique features) X 100
For example, If 5,000 consumers use the meditation app every day, and 1000 of those users use the journaling feature, that comes out to 20% of unique users that actively utilize the feature.
4. Product Adoption Rate
What does it mean?
Product adoption rate can give you great insight into the depth of user engagement. It tells you up to what extent the product is being used by a customer in a fixed period of time. You can understand how quickly your users are getting around the product to make it a part of their key operations.
How to calculate it?
It’s the percentage of your key features used by an account in a fixed time frame. The features can be used by any user added to that account and the period considered commonly is of 30 days.
Product Adoption Rate % = (Key features used / Total key features) X 100
For example, if your product has 10 key features and an account’s users have tried 8 features in 30 days, then the product adoption rate would be 80%.
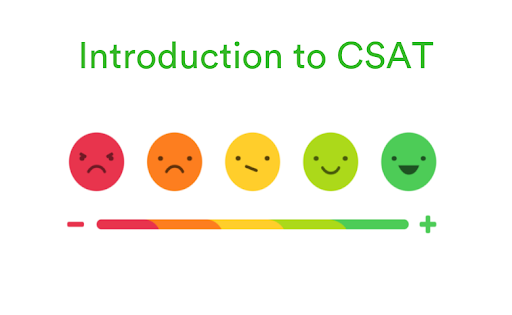
5. NPS & CSAT
What does it mean?
The best way to know how satisfied your users are with your services is to ask them.
NPS is the Net Promoter Score that users give to rate your product performance.
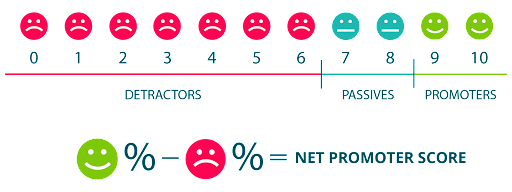
CSAT is the customer satisfaction score users give for your services.
Bonus: Engagement Score
What does it mean?
The engagement score is a metric that shows how engaged your customers are with your SaaS product or mobile app. It’s one of the best churn predictors out there; the correlation between churn and engagement is high.
How to calculate it?
There are two main factors taken into consideration while calculating the engagement score:
- The number of specific engagement actions performed in the last 30 days
- The frequency with which those actions were performed
Your customer engagement score can help you pinpoint customers that:
- Are ready to upgrade to a paid package;
- Need help or are about to churn;
- Are ready for an upsell or cross-sell;
- Are great candidates for writing reviews, ideally in correlation with your NPS score
By knowing the engagement score and using automated notifications, you can prevent churn while users are still active, and improve customer experience and satisfaction with your product.
Wrap Up
Before you start creating documents with lots of data and numbers, remember two things:
User engagement metrics don’t exist in a vacuum. Meaning: to know your users, what features they like, and which features to change or add, you need to look at all of these metrics together.
And more importantly, just noting down these metrics won’t be helpful. You need to have a plan to draw insights from these and make constant improvements in your product or user experience.
This is a guest post by Trevor Hatfield, Managing General Partner at Inturact
Trev
or’s career began as a freelance learning applications developer and designer. After finding success in software he moved into SaaS consulting, and started the SaaS growth agency, Inturact. Over the last 10+ years Inturact has helped many SaaS companies find scalability and get acquired. Inturact is also an investment vehicle for Inturact Capital – a private equity fund that acquires, grows and exits SaaS companies.