Chase your company’s revenue at all costs, and your clients won’t stick around.
Help your customers thrive, and your income will be automatically guaranteed.
The ultimate and bravest way to do business is to put your clients’ interest at the heart of your business. This is how you’ll get them to stick with you for the long term.
Here’s my challenge for you
To prove my theory right, I challenge you to leave aside the classical mentality for a couple of weeks and take out revenue as the main KPI from your dashboard – just for a little while. See what happens.
5 Dashboards by 5 SaaS Growth Experts
In fact, to test my theory, I asked 5 CEOs in the SaaS industry how they envisioned a dashboard that lacks the most common KPI out there – the company revenue. I asked them to draw their ideal dashboard on a napkin.
This is what they came up with:
The ‘Money for my Customers’ Dashboard
Author: Tony Freed
Tony drew the dashboard of a FinTech company, with a very clear product goal: to help other companies reduce costs by eliminating duplicate subscriptions.
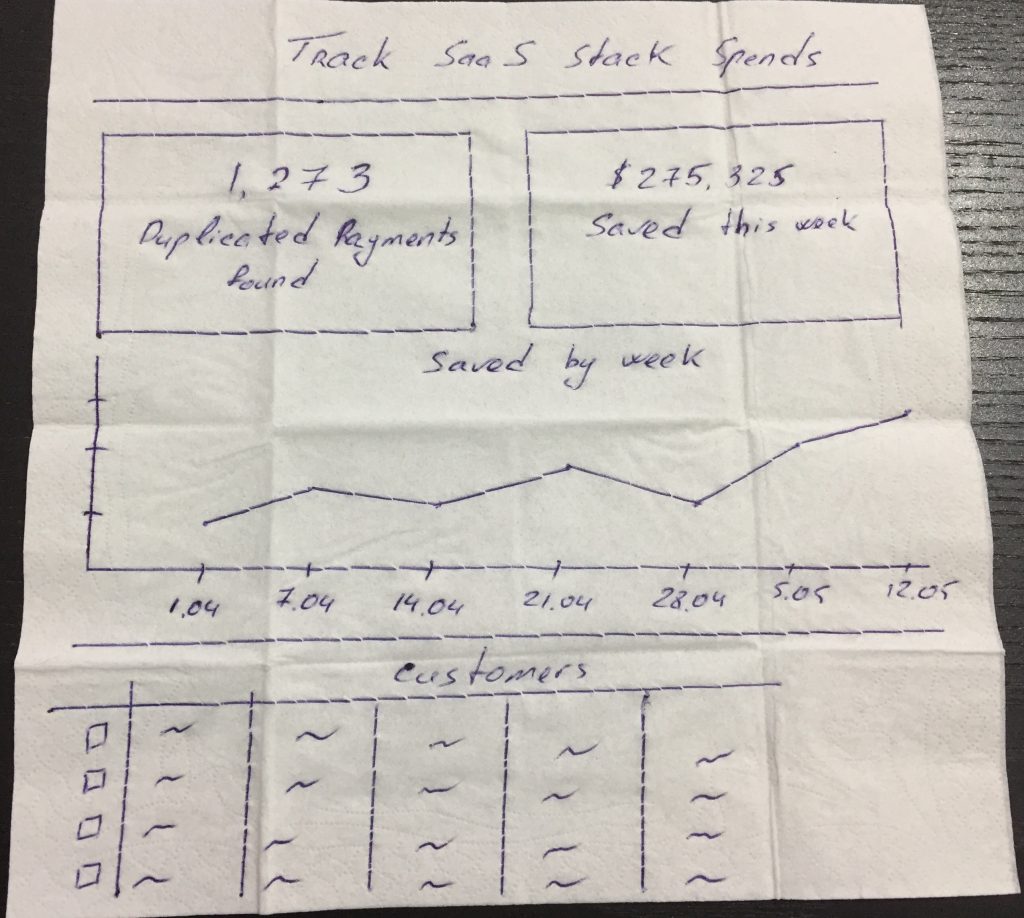
At a first glance, I was under the impression that Tony’s napkin didn’t hit the mark, as it contained a big box with $ in it. The whole point of this article was to prove that money shouldn’t be the main KPI for companies, and seemingly money was at the core of Tony’s napkin.
I took a second look at his dashboard, and then it hit me. Tony didn’t only understand what I was trying to prove, but in fact he went one step further.
His money box didn’t refer to the amount of money the company generated from the clients. On the contrary, what he is interested in is how much money the company generates for their clients. And this is indeed the most powerful achievement a SaaS company can have, which will maintain its clients for the long run.
I definitely share Tony’s point of view. I think a truly brave B2B SaaS company should be aiming at generating value for their clients, which in turn will generate value for them. It’s the highest level a company can reach: sticking by their product value.
The APT-VISA Dashboard
Author: Susan Nabeth
 |
Passionate evangelist of customer success in Europe
|
Sue’s dashboard is specific to companies that are already mature and master their segment of the market. These companies usually need to have an instant overview of the status of their business. This includes the most important metrics for each department.
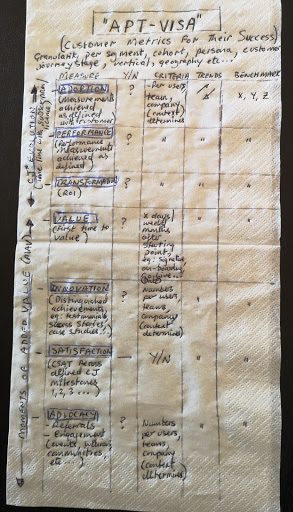
Sue’s dashboard is very detailed and shows very clearly the value a business delivers to its clients throughout the customer lifecycle, starting from acquisition all the way to retention.
Basically, it includes a variety of metrics belonging to all the departments in the company, making it relevant to the entire team. This is done by showing them the value of their work at any time.
And I’ll tell you one thing: nothing can be more motivating and bring you more satisfaction than seeing very clearly the value your work generates for the customers, and therefore for the company. Not even the salary, a bonus or some perks. And this is the sort of dashboard that does just that. It shows exactly how you contribute to the business.
The AHA Dashboard
Author: Ricardo Ghekiere
 |
B2B Founder and Marketer, CEO of SaaSmic
|
Ricardo provided us with an example of a SaaS company at the other end of the spectrum from Sue’s. It’s a glimpse into the dashboard of a small company which is on the rise.
And it’s a very daring dashboard indeed, that any start-up should follow.
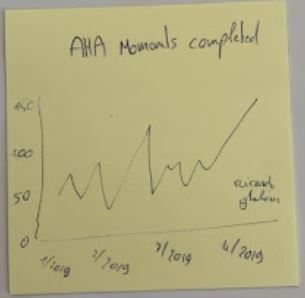
Ricardo clearly suggests that the no. #1 objective of small companies that reach the product market fit stage should be to see how many people reach the AHA moment. Everything else is just details.
When you are just starting to grow, the conversion between the AHA moment and the payment usually doesn’t change much. Basically, small adjustments made by small companies don’t have a big impact.
The greatest impact on the revenue is given by how many people get onboarded and reach the promise of the business. This moment is known in the industry as the AHA moment.
The ‘Love in, Love Out’ Dashboard
Author: Sam Hurley
 |
Marketing SpecialistSam is the Guy Who Went From ‘Nobody’ to #1 Marketing Influencer in 15 Months (Without a Website) |
Sam’s napkin is all about the love – the love for the product that is.
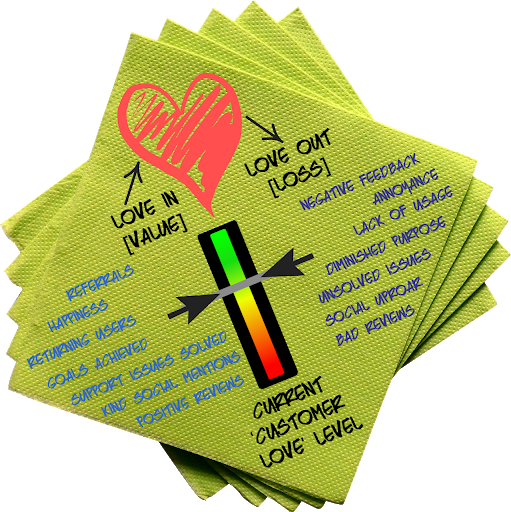
His approach is very bold, focusing on what people are doing outside the product.
In other words, the most valuable products will always generate a lot of buzz outside the product. All the links people share, the referrals, positive or negative discussions, reviews & testimonials etc – they all happen in the social media, outside the product.
A truly successful company will have much more positive feedback than negative. In Sam’s own words: more ‘love in’ than ‘love out’. So if the product is valuable, we will hear less about support problems, bad reviews or decreases in the product usage.
The comparison between the two gives us the value of the product on the market. And be certain that the bigger the gap between these two, the faster the growth of the product will be.
So, there – another expert who doesn’t view the company revenue as the main metric, but focuses on the quality of the product.
Last but not least, we received a dashboard from Michiel Vermeulen, Global Sales- & Account Director at Swydo.
The ‘Conversations drive Retention’ Dashboard
Author: Michiel Vermeulen
 |
Global Sales- & Account Director at Swydo Michiel develops new business strategies with a specific focus on the onboarding of companies that are looking for online marketing reporting solutions. |
Just like Ricardo, Michiel refers to B2B companies that are on the rise. He takes the discussion one step further, by introducing the human factor in the onboarding process and retention.
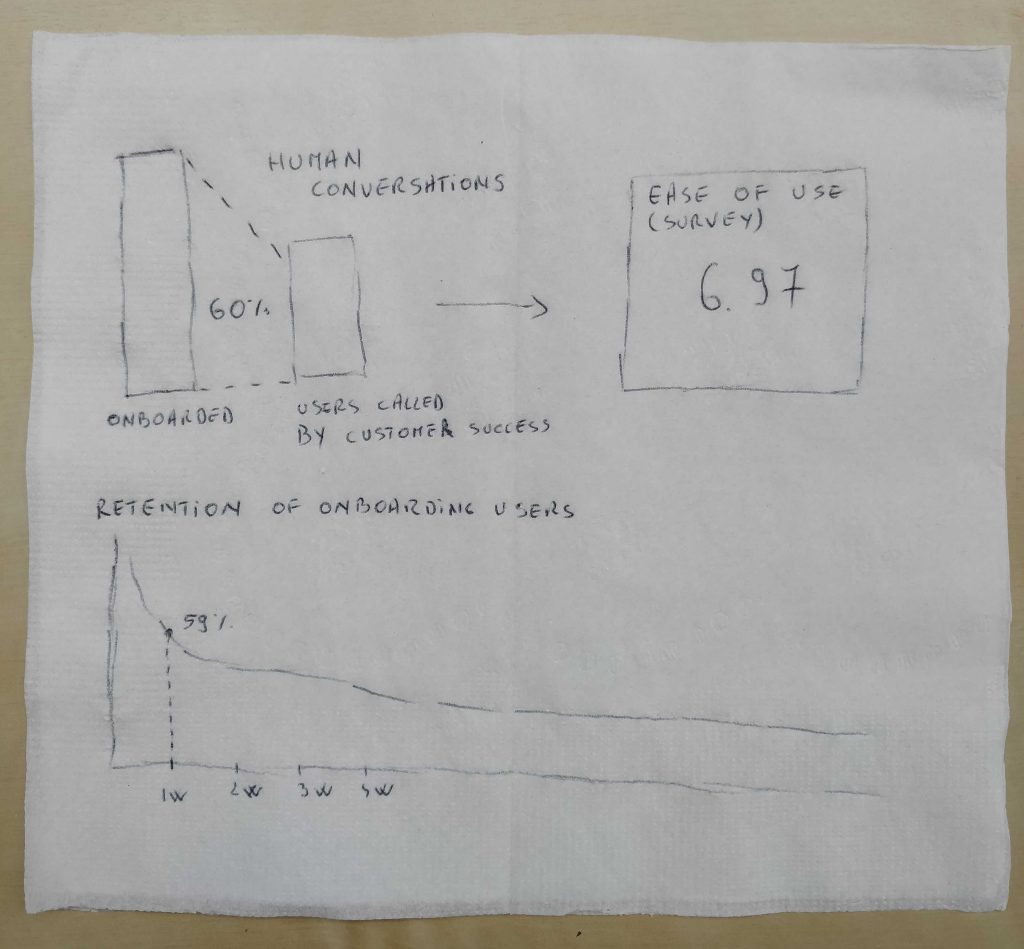
Michiel is interested in how many people reach the onboarding stage, and from that moment on how many of them have a human interaction with someone behind the product. Moreover, he wants to know what’s their retention compared to those who have no interaction with the team.
The beauty of this dashboard is that it shows the value of the human interaction and it can quantify it according to its impact on the business.
Human interaction is the most direct method possible to understand the clients’ needs and find out the value you deliver to them.
No revenue on this board either – have you noticed?
And now our very own dashboard – here at InnerTrends:
The ‘Delivered VS Perceived Value’ Dashboard
Author: Claudiu Murariu
 |
CEO & Co-founder at InnerTrendsHe is also a passionate blogger, the author of DataDiary and a speaker at international conferences. |
Let me share with you our vision of an efficient dashboard.
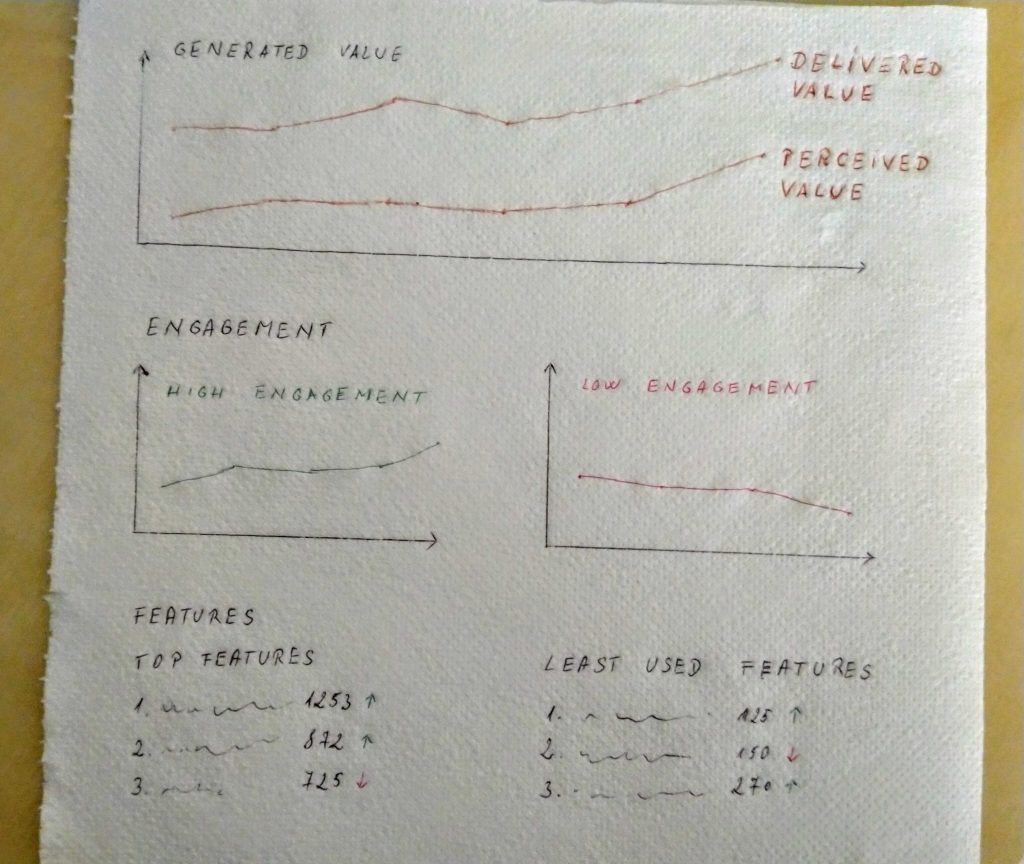
App Value
When it comes to value, there are two elements to take into account:
- the value delivered by the app – which refers to the actual functions of the app, and
- the value perceived by the user – which refers to the users’ opinions of the app and the benefits they get from the app. This is a subjective view on the app.
Here are some examples of delivered value:
| Type of App | Delivered value |
| Bookkeeping App | Generated Invoices |
| Form Builder App | Form Submissions |
| Reporting App | Generated Reports |
For the same businesses, here are examples of perceived value:
| Type of App | Perceived value |
| Bookkeeping App | Invoices sent to customers |
| Form Builder App | Form Submission downloads |
| Reporting App | Reports views |
When looking for apps, users actually search for solutions to their problems, not for a particular function, so when they find the magical solution, many times they stick to the function(s) that helps them out and are not interested in the other functions the app offers.
In other words, users are not always aware of the whole package they receive, and thus of the full value of the app.
The gap between the ‘delivered value’ and the ‘perceived value’ tells us how well the app is doing in converting users into paying customers.
The smaller the gap, the better, as this means the app is judged as close as possible to its full potential.
Users’ engagement level with the app
The level of engagement of a user with an app is a good indicator as to how much the users get involved in finding the app’s value. It can vary from no- or low engagement, to medium and high engagement.
To learn more about how you can score your customers’ engagement and define engagement categories, check out my previous article on this topic.
A high engagement level with the app means that customers are trying to use as many features as possible in order to make the best out of it. In such cases the gap between the delivered value and the perceived one is very small.
App Features
When it comes to features, we make a top for the most-used features and one for the least-used features.
This report speaks volumes on the areas of your app that are most relevant for the users and thus generate most paying customers, and the ones that could be improved or even left out. It tells us how valuable your product is to the users and how many of them should be paying customers.
Have you noticed that our dashboard here at InnerTrends doesn’t include the revenue? That’s because we don’t aim directly at revenue, money is a by-product of keeping customers happy.
No more revenue on your dashboards
In the end my theory was confirmed: whether we are talking about well-established SaaS companies or startups that are on the rise, the big names in the industry agree on one thing: bringing value to your customers is more effective than chasing money for the sake of money.
So I remain a strong believer that money shouldn’t be the ultimate goal of a company. It should be the consequence of the way you help your clients.
Your turn now!
If you agree with me or if you’d like to challenge this theory, I’m more than happy to hear about your experience on the matter.
And if you want to give this theory a go and wish to implement a non-revenue policy for a while, I can always help you get started. Just email me at [email protected].
Also, if you need help in understanding how much value your users are getting from your product, schedule a consultative 30-minute call with one of our analysts.