That’s right, you either give up because the data doesn’t look to be doing anything (as in the first example) or you get into a panic when you discover tracking stopped working a few months ago and there is no data to analyse!
Today, in a bid to help you take the action you need to grow your business, I bring you the InnerTrends Analytics Schedule Calendar.
Starting with the reports that need your attention every day and moving to those reports with a lower frequency, the analytics schedule calendar will take the guesswork out of checking your reports.
Every single day: What’s up?!
Depending on the numbers, when I check my dashboard I either get a huge boost of instant motivation or I get close to panic mode. It’s enough to wake me up from any state!
If you’ve ever thought about cutting back on your morning coffee I have just the solution for you: Check your analytics dashboard instead.
But here’s the thing: You don’t want this dashboard to be too complicated. It just needs to set the mood & direction for the day.
Ideally it should include no more than three metrics, displayed in an easy to digest manner so that everyone on the team wants to check it, not just your web analytics geek!
Having this daily update sent to the whole team via email or as a Slack update ensures that everybody is on the same page, right from the very start of the day.
Depending on the priorities of your company, here are a few examples of what this daily report might include:
Pre-launch company:
- Visits
- Newsletter subscribers
Beta product:
- Visits
- New leads
- New activations
After the first sale:
- Active users
- New users
- New customers
As sales are starting to grow:
- Daily revenue
- New customers
- Lost customers
Accelerating:
- Daily growth
- Advertising spent
- Attrition (inactive users)
Here is an example of an email for the “sales are starting to grow” companies:
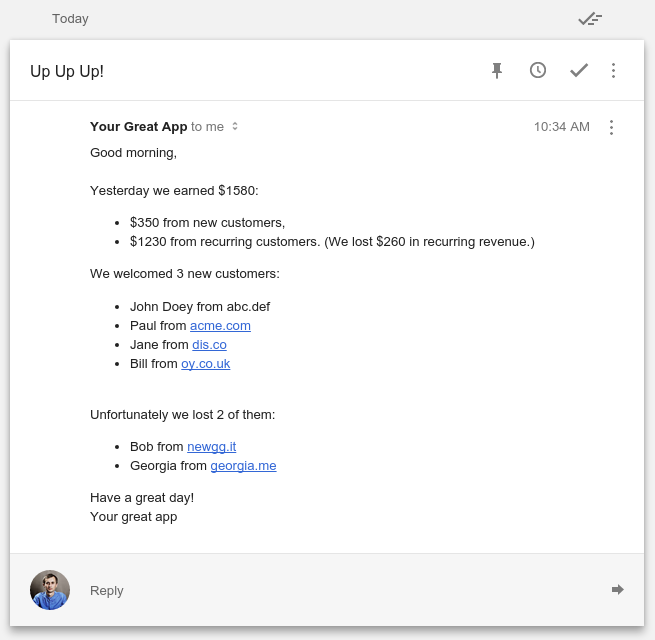
What I love about this email is that it’s truly actionable. We can send a quick personal note to any of the new customers if any of them looks daunting or you can personally reach the lost customers and find out what went wrong.
An important aspect of email dashboards is to not abuse them. If it becomes routine to mark them as read, stop them or change their content to something that is the new “actionable data”.
The first day of the month: Executive Reports
The first day of each month should be dedicated to executive reporting.
An executive dashboard is a one page report that lets you see in an instant if the business is growing (or not) plus the reason for the change.
These reports are typical for companies that are already earning revenue where the daily reports don’t paint a clear picture of how the company is growing.
The executive dashboard should always contain a prior set objective and data should be reported against it.
An added bonus of compiling the executive reports is that they are usually required when dealing with investments so having them set each month means that you will never be taken by surprise.
What should the report include:
Monthly Total Revenue
A trend showing the last 12 months of total revenue. If you are in the subscription business you’ll want to split this into new acquisitions and recurring revenue.
The chart should also contain the objective path that you’ve set at the beginning of the year so you know if you are growing as expected.
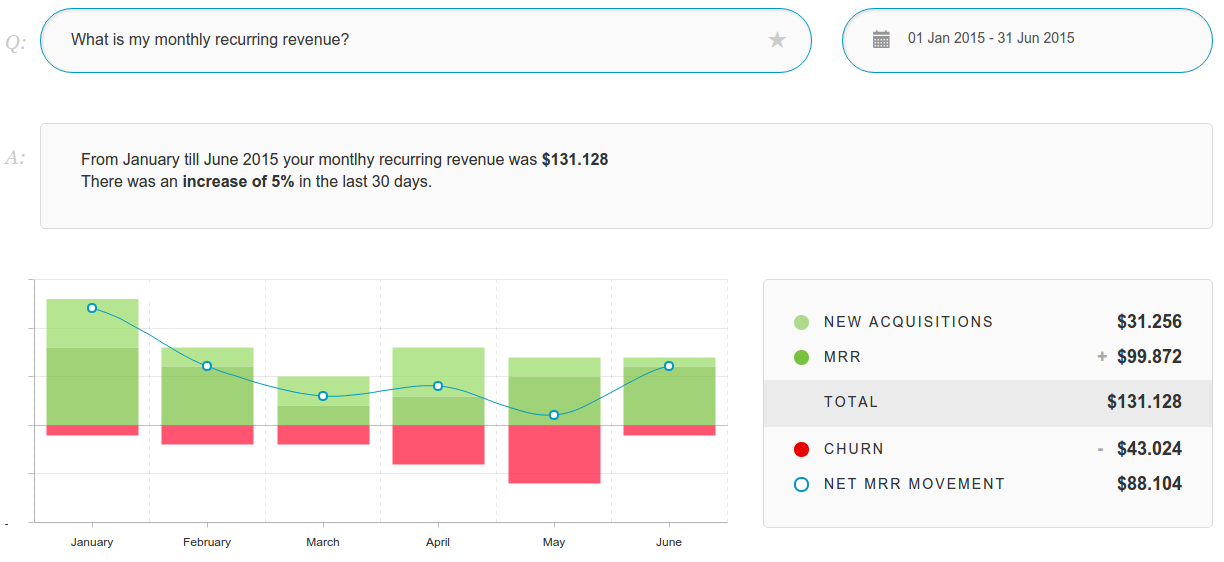
MRR movements
MRR movements is one of the best executive reports because it gives a very quick picture of the health of your company.
It shows if you don’t get enough new customers or if you lose too many old ones and the rate for each event.
Here is an example:
Onboarding conversion rate
The onboarding process is the first (and usually the most difficult to optimize) bottleneck in your product. It’s what generates active users and, for an executive, only active users matter.
A trended conversion funnel does a great job of showing how the onboarding process is doing over time.
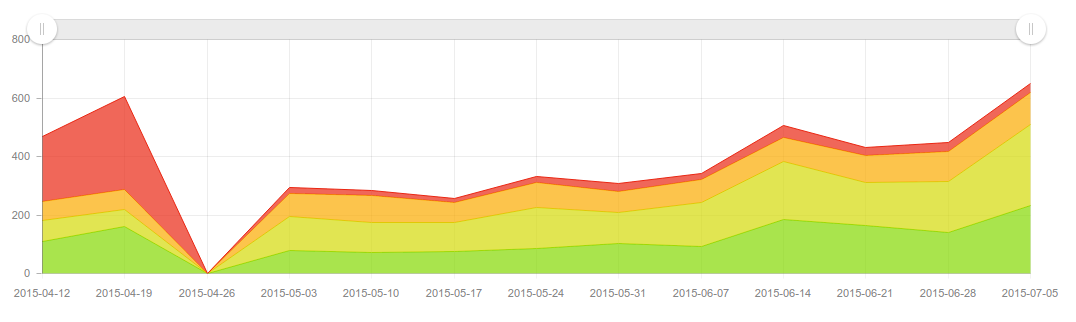
If an executive is asking you to create this report for him each month, I suggest the following format:
The first day of every iteration: Grass root reports
Most companies now develop based on iterations which can be as often as weekly. The great thing about iterations is that they come with a clear objective which means clear focus.
Every time a new iteration is about to start, companies often focus on what is going to come next while forgetting about previous iterations.
So, the first thing to do before starting a new iteration is to report on the previous ones. For each iteration you will want to report:
- how many people have been impacted by it
- how many people became inactive after using it
- how many people were reactivated by it
The following reports will help you in reporting on each new development:
Funnels & Paths
Funnels & path reports are great at showing you if and how many people are doing what you expect them to.
You just launched a new feature? How many people click on it to see what is it about and how many started using it.
Here is how a report might look:
Feature usage
Every app or service consists of features that people pay (or not?) to use. As more features are added there’s a real danger that some features will not be used, become obsolete or are not what the users need.
That’s why it’s important to have a clear picture of how each feature is used. This simple report will tell you quickly where you need to focus during future iterations.
User re/in/activation
The reason we develop features in the first place is to keep users addicted to our app or service. However, as sad as this sounds, users will leave you, sometimes for reasons not related to you, but sometimes because of something you did or did not do.
Each time we launch a new feature we want to know if it was beneficial (how many users did it cause to reactivate) or not (how many users decided to leave us after using it).
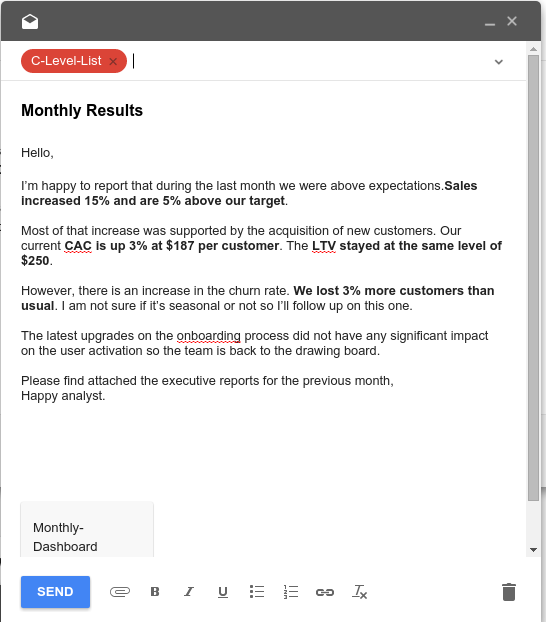
During and after each marketing campaign: Marketing reports
Marketing campaigns are what drive new customers and are a critical element of any analytics strategy.
The goal is profit: spend less on acquiring every customer than what you charge that customer over time.
LTV & CAC
Lifetime, lifetime value and cost of acquisition are a set of metrics that will have a direct impact on the future of your company growth.
Depending on the lifetime of each customer that you acquire it can take sometimes take months before you can be sure that you made the right investment in a marketing channel.
Checking lifetime value and cost of acquisition against a pre-set objective is critical because your goals will simply not be met if your numbers are under it.
They are not easy metrics to calculate as they depend on a lot of factors.
Profit
Over time you’ll want an answer to the question: From the budget I invested in January on acquiring customers, how much revenue did it generate by June?
And you’ll want to answer this for each individual campaign you run.
By the time you learn about the campaigns that did not do well it might be too late to decrease the losses, but at least you’ve learned a valuable lesson and you’ll do everything you can to not repeat it.
Channel Cohorts & Conversion Rates
What you can do is to check conversion rates for the campaigns that did not do well in the past, together with the user segments that were specific to them.
Match that data against the existing campaigns and make sure that you are avoiding making the same mistakes again.
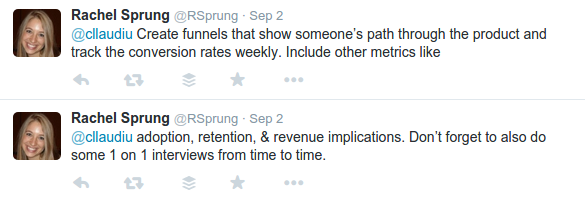
Marketing reports have a life of their own. I recommend When to Check on Your Marketing Metrics: A Simple Guide by Rachel Sprung @ Hubspot.
I asked her to share her advice for scheduling reports. Here is what she said:
Your turn now. Are you using a web analytics calendar? How often are you checking your reports? What would you like to improve about it?
Looking for deep insights into how your customers use your product?
InnerTrends can help. You won’t have to be a data scientist to discover the best growth opportunities for your business, our software will take care of that for you.
Schedule a Demo with us and witness with your own eyes just how powerful InnerTrends can be.