I always strive for zero churn.
Of course, I too have customers who are leaving, but the only times I accept churn without putting up a fight is when companies are closing down, people are leaving companies or budgets are being cut.
I just can’t accept it when people are leaving because of my product, well, at least after they find value in it.
In the following lines I’m going to share the questions I am expecting my data to answer when it comes down to understanding and optimizing retention.
But, first thing first: before jumping straight to optimization you have to know your stats.

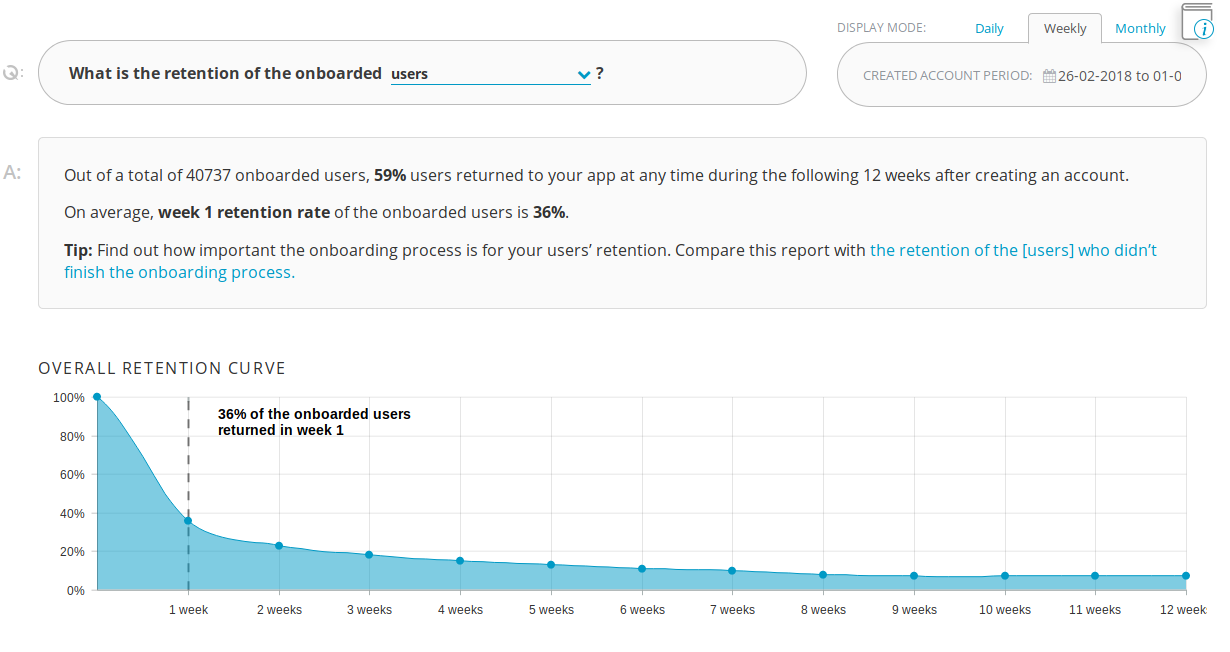
1. What is the retention of new users?
It’s important to look not just at any new user, but only at the users who have finished the onboarding process.
Here’s an example of how a retention report for the onboarded users looks like.
Why not include those who haven’t finished the onboarding in the report?
Easy: they have no reason to come back to your product. They just ruin your stats and give a false image of what’s happening.
To find out more about how basing your retention reports on sign-ups offers an inaccurate image on your business growth, you can check out this article.
So, when analyzing the retention of your users you have to take into account two aspects:
- What is the retention after the first week?
Basically you need to know how many people finish the onboarding and come back to your app after one week.
- Which is the moment when retention stabilizes?
Many times retention has high values after one week, but it gradually decreases as the time passes. It can drop dramatically in a matter of weeks until it stabilizes.
Ideally, the stabilization should happen during the first week. This is what you should be aiming for and it is no impossible feat. In fact, we do have a client who’s retention stabilizes at around 45% during the first week.
Why is it ideal to stabilize retention during the first week? Because if you manage to do so this early in the game, all you have to do is optimize just one thing: the number of people who come back during the first week. If you manage to increase retention from 45% to say… 60% during the first week, this figure will stay there even after the first week.
If retention stabilizes after more than one week, your efforts of optimizing retention during the first week offer no guarantee that the results will extend over the following period. So then you will have two optimization projects to put in place: optimizing retention during the first week, and optimizing the moment of stabilization.
Once you know the stats related to retention, you need an optimization strategy.

To do that, you will have to crunch the numbers and answer questions with respect to:
- the number of onboarded users who reach the goals of your business
- the difference in activity between the users who come back to your product and those who don’t
- the number of net active users
So let’s get straight to the questions:
2. How many onboarded users reach the various goals of your business?
The most important goals for your business are:
- Clients performing critical mission actions in your app. Let’s assume you have an accounting app that issues invoices. The question you need to answer is: how many people issue 10 or 20 invoices?
- Clients paying for your product, which is probably the most important goal.
When analyzing how many new users reach the business goals, especially payment, it’s important to look at how many users paid but never finished the onboarding process. They are of high value (they gave you money) but they will churn very soon (they don’t get any value from you).
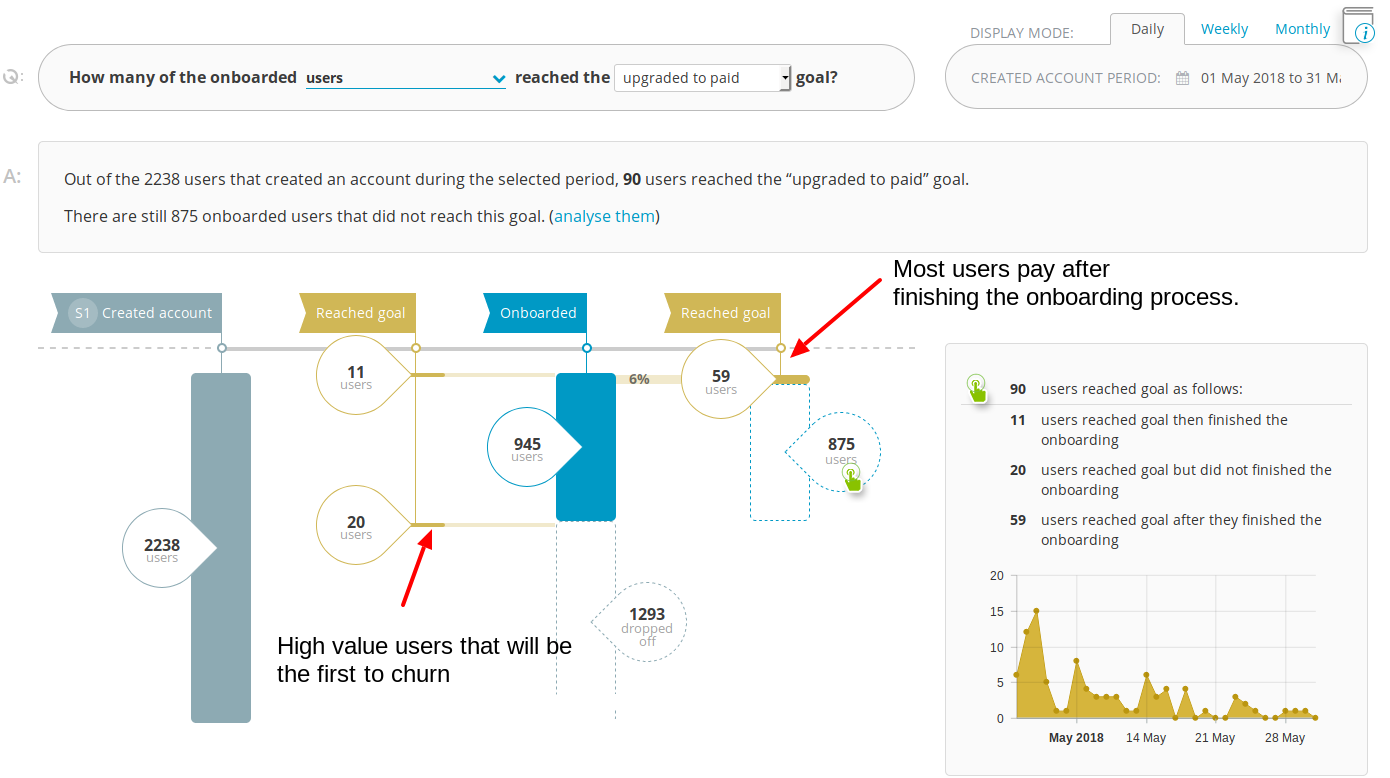
When it comes to the goals of your business, you should analyse two other crucial aspects:
- Which is the retention of the users who reach these goals? Stats show that, generally speaking, the retention of those who reach the goals is much bigger than for those who don’t. So, if you optimize the goals, the retention will go up.
- How much time do users take to reach these goals? This will tell you which is the communication timing for optimal results.
3. What is the difference in activity between the users who come back to your product and those who don’t in the first two or four weeks of activity?
This report shows you when exactly users experience the wow moment.
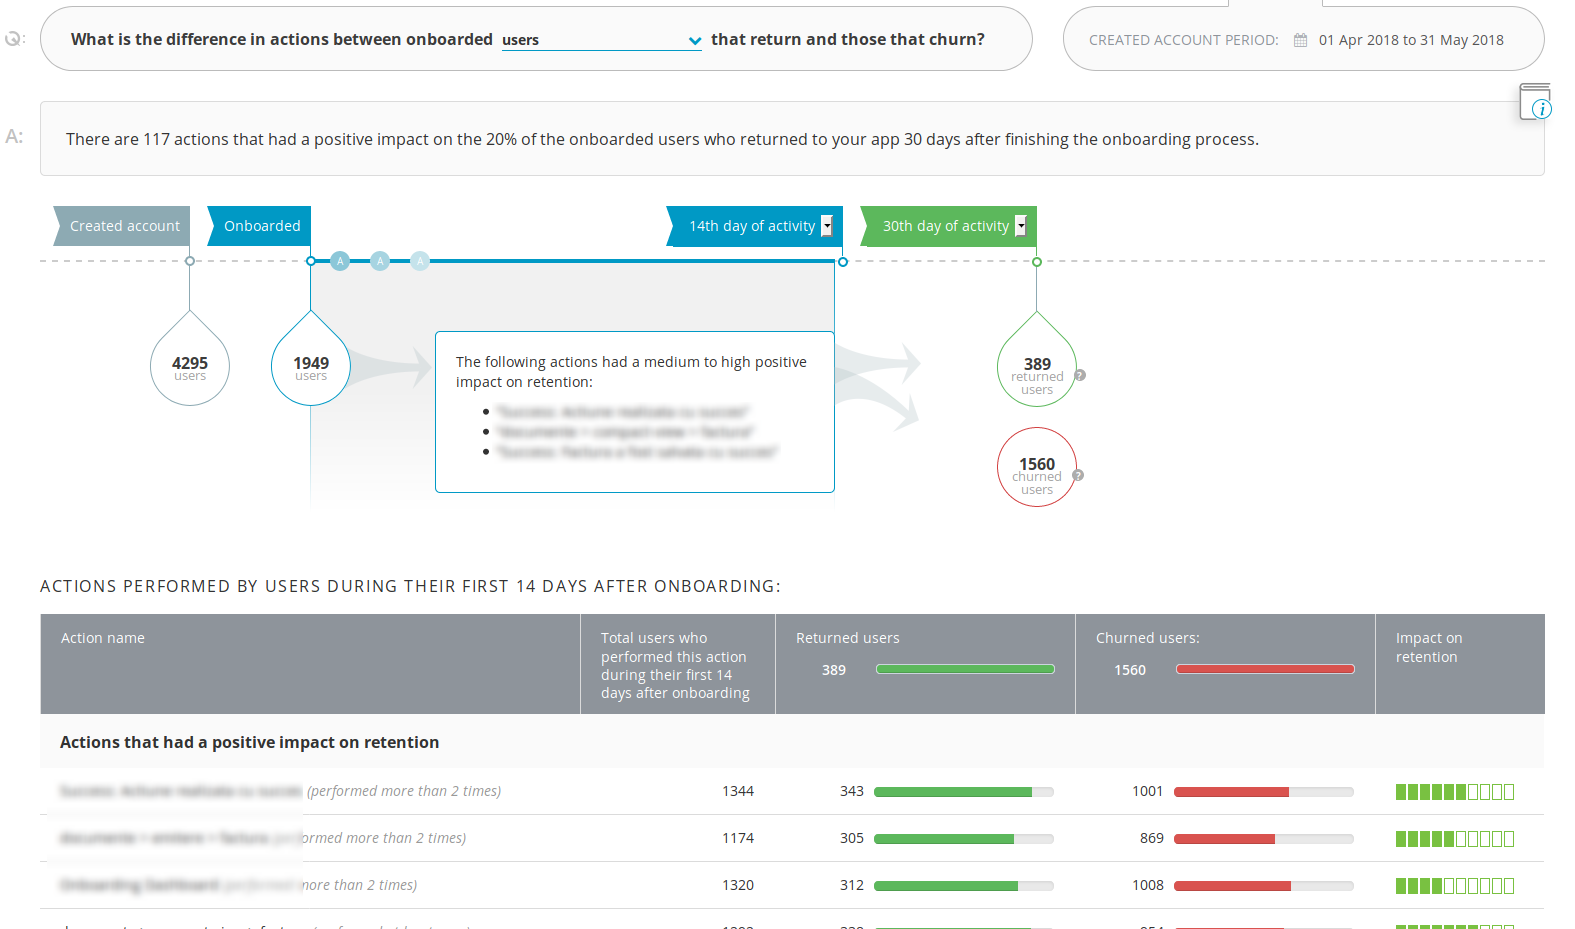
Basically, it shows you that if users perform actions X, Y and / or Z, they have much more chances of coming back to your product than if they don’t. It pinpoints to the precise features and actions that are important for your users.
Take the case of one of our customers, a marketplace whose difference in activity between those who were coming back and those who weren’t was the number of messages sent between its members.
This was a feature which that platform never optimized since the launch of the product. And it was a shock for them to learn how this aspect impacted users.
4. Which is the net active users number?
Net active users is defined as follows:
Net Active Users = New Users + Returning Users – Churned Users
This metric shows the growth of your company. Here is an example of a company with a good growth of net active users.
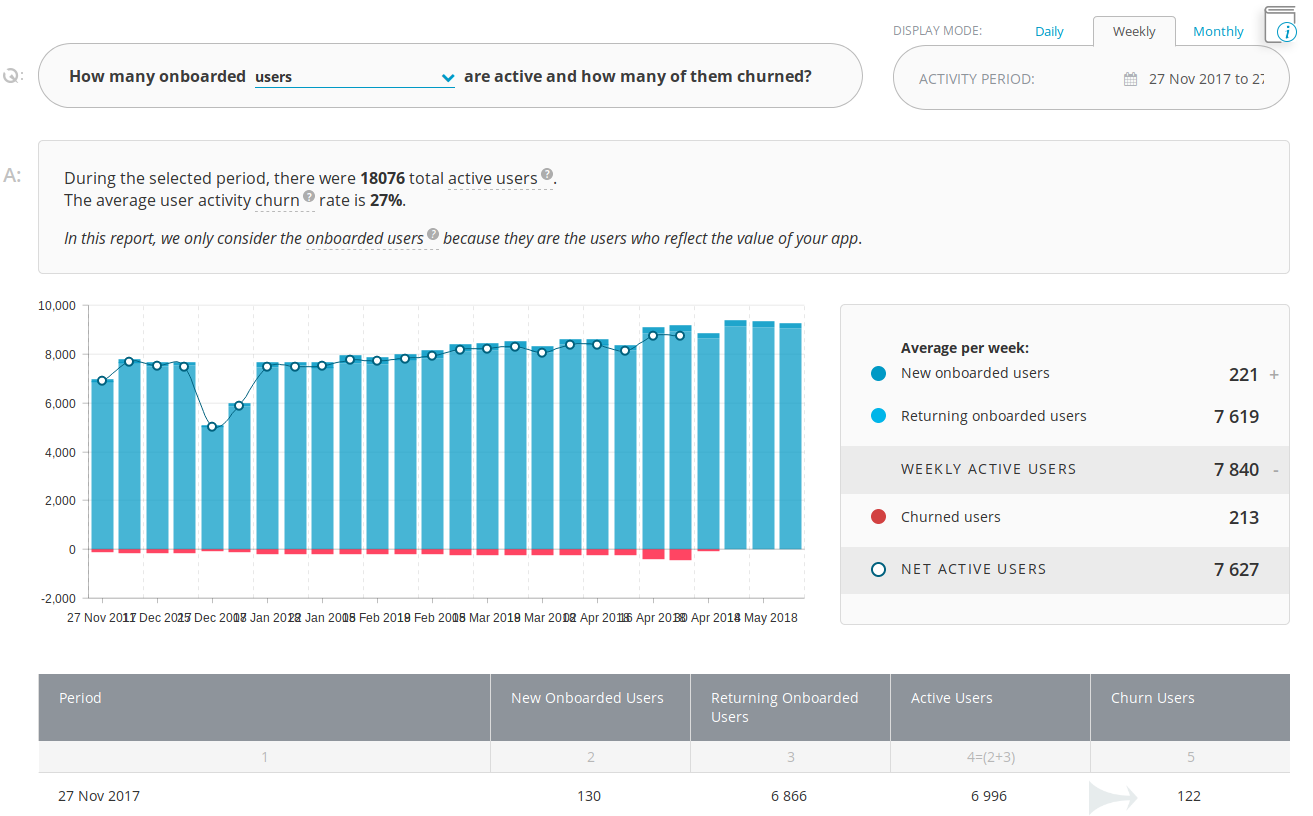
Out of these numbers, the returning users and churned users are directly linked to retention.
If you gain a certain number of users / month and you lose the same amount of users, your business obviously stagnates.
But if you manage to optimize retention by 10%, the net active users report will tell you what impact this optimization will have for the future.
So, basically, once you know what the retention of the onboarded users is, you need an optimization strategy based on:
- the number of onboarded users who reach the goals of your business
- the difference in activity between the users who come back to your product and those who don’t
- the number of net active users
If you’re looking to get deep insights into how your customers use your product, InnerTrends can help. You won’t have to be a data scientist to discover the best growth opportunities for your business, our software will take care of that for you.
Schedule a Demo with us and witness with your own eyes just how powerful InnerTrends can be.