
Analyze user behavior and conversions with cohort reports – the method that mirrors reality.
What cohort analysis is NOT
Let’s say you’re analyzing an event – maybe it’s webinar registrations, or clicks generated by a paid campaign – and you need to build a report.
I’m willing to bet that your first impulse is to build a report that will look a little something like this:
Step 1: Select a period of analysis from a calendar widget (e.g., January 1-31)
Step 2: Choose metrics (e.g., visits) and dimensions (e.g., goals) that need to be reported
Step 3: Load the report
You aren’t alone – this is the most common method for analyzing specific events performed during a selected period.
But what if I told you this report is misleading?
In this scenario, the non-cohort method described above may lead to insights that generate more harm than good (eg. your paid campaign is terrible at generating conversions, when in reality it’s a winner).
Why?
Because accounts and users will have ongoing behavior that will always be partially captured in the selected period when using the above method.
In other words, whenever you’re trying to analyze a specific period of time to understand user behavior, you’re not capturing the behavior towards conversion, or even the conversion itself (if it happened after the selected period).
Putting the non-cohort method to the test
Let’s look at an example: it’s the end of the quarter, and you need to report the performance of an advertising campaign that ran in the first month of the quarter.
You generate the report using the non-cohort method we described above, and you report the results:
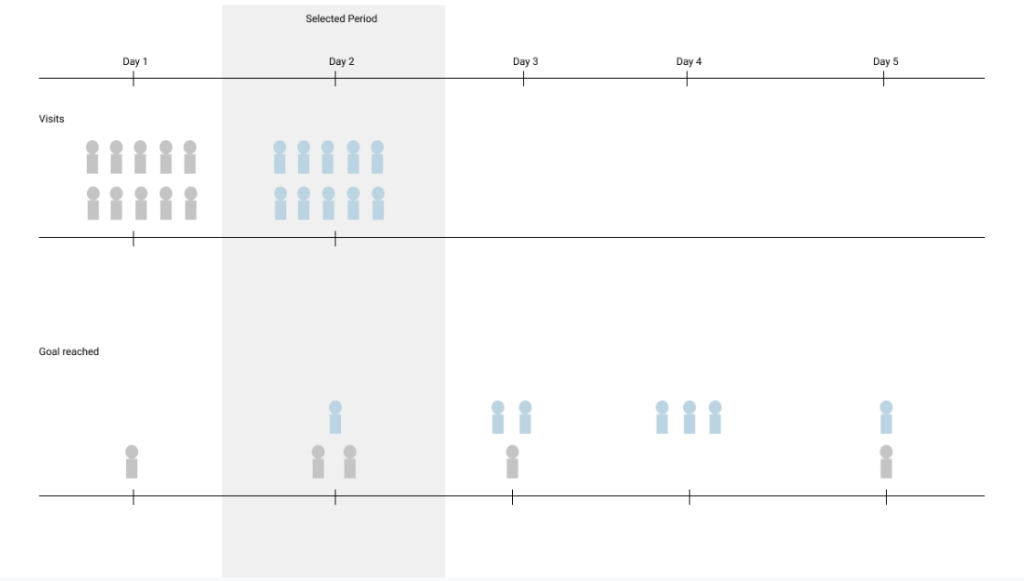
When analyzing data the non-cohort way:
Conversion Rate: 30% (10 visits and 3 goals reached)
Important: 2 users that reached the goal didn’t visit on that day, offering a misleading image of what happened.
As you can see in the image, more users converted outside of the selected period. As a result, the campaign would be deemed as underperforming.
That’s why cohort reporting was introduced for analyzing user and account behavior. It offers an image that mirrors reality when analyzing user behavior regarding any type of conversion or goal-reaching.
What IS cohort analysis?
Let’s start simple:
- A cohort refers to a group of users who experienced a common event in a selected time period.
- A cohort analysis looks at the activity performed by that cohort of users even outside the selected period.
Now let’s dive into the nitty-gritty:
Cohort analysis refers to a report that extracts a group of users (=a cohort) that need to be analyzed. They share a common action performed in a specific time (the select time for analysis), and the analysis then looks at all of the activity that group has performed, even if that activity happened outside of the selected time frame for analysis.
Here’s the same scenario from above, but analyzed using cohorts:
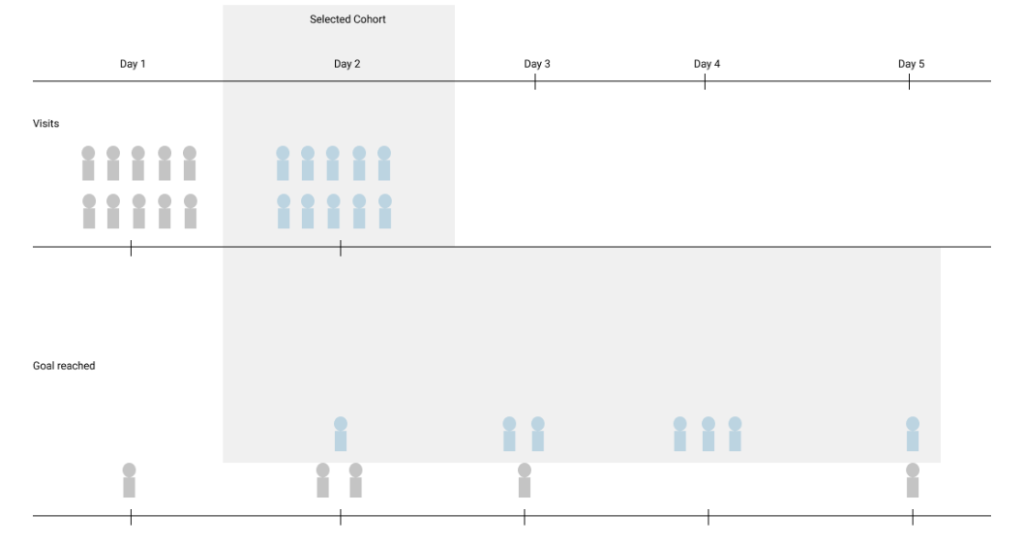
When analyzing data the cohort way:
Conversion Rate: 70% (out of the selected cohort of 10 users who performed a visit on a specific day, 7 of them reached the goal as follows: 1 on the same day, 6 reached the goal in the following days).
Cohorts are not only for retention
Most people are familiar with cohort retention reports that look like this:
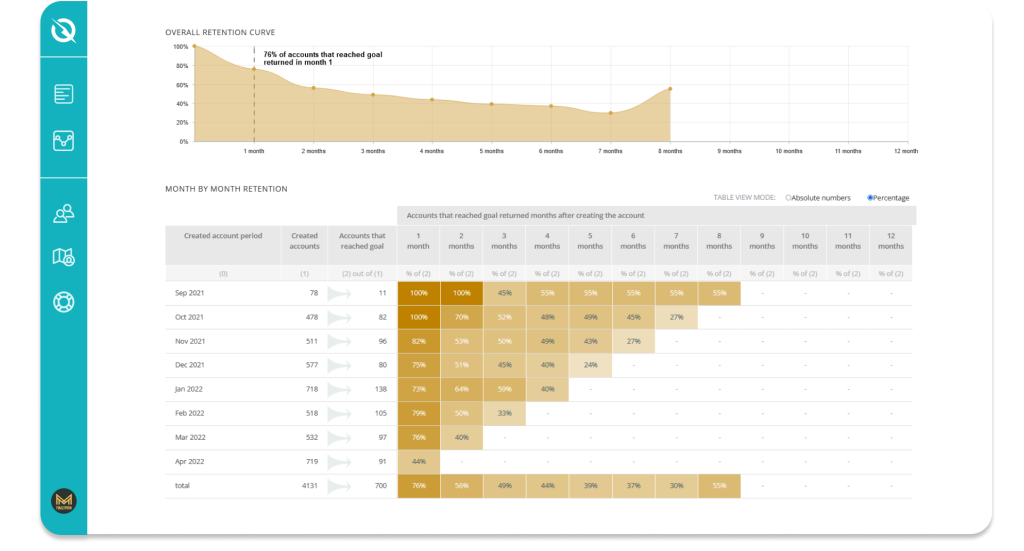
The above visualization has the cohort of people that created an account in a specific week in the first column, and then reports week after week how many of them returned to the product. The higher the percentage, the darker the background color for that specific week.
Though very popular, the above is just one example of a cohort report visualization. In reality, almost every conversion report can be analyzed as a cohort report offering a much more accurate analysis.
A practical cohort analysis example
InnerTrends is a cohort-based analytics platform. All the pre-built reports will let you / ask you to select a cohort: all of the accounts that share a common activity during a selected time period.
The conversions are then calculated automatically by looking at the activity that users/accounts performed at any time during or after the selected period.
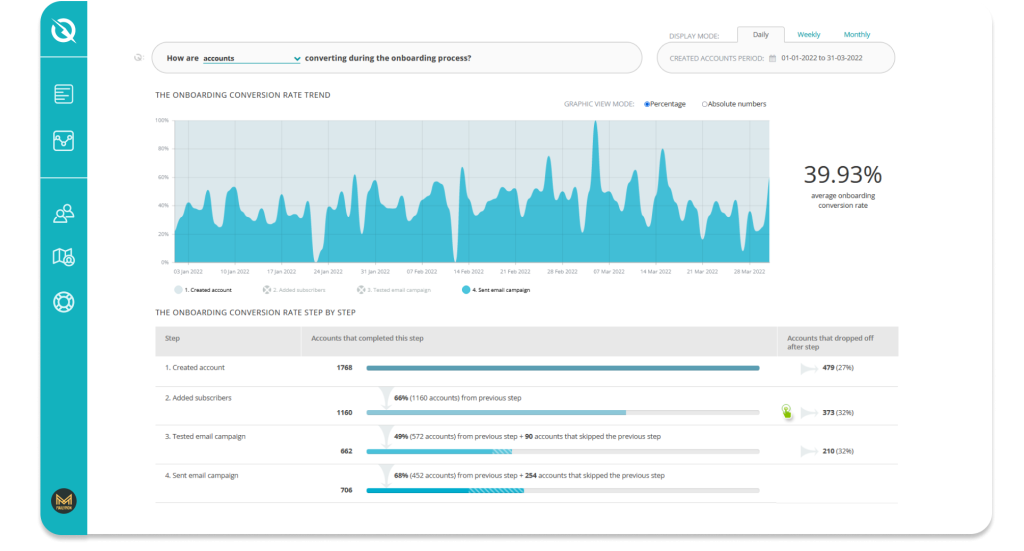
For example, when selecting the pre-built report: “How many accounts were created and how many are now onboarded?” you will just need to select the period when the analyzed accounts were created. That’s the analyzed cohort:
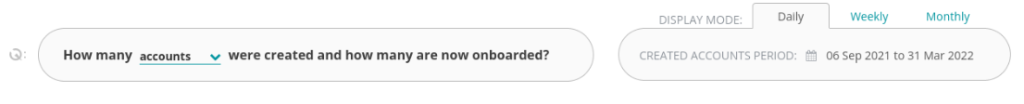
InnerTrends will then look at the activity these accounts performed anytime during or after the selected period, and see which of them performed the event that marks the end of the onboarding process. All of them will be considered onboarded, regardless of when they finished the last step of the onboarding process.
Whenever you come back and look at this report, you’ll get an updated image of the onboarding conversion rate. That’s because over time, other accounts which were previously not yet onboarded, now may be onboarded. The only thing that will stay constant is the number of people that entered the cohort.
Because of this, cohort reports are the best way to analyze behavior and conversions, as they are the only reporting method that mirrors reality and does not offer a distorted and often misleading image.
Analyze user and account behavior with cohort analysis
Remember: cohort analysis allows you to get a true, accurate image of conversions and customer behavior by tracking and analyzing account segments’ actions over time.