
Does all friction kill conversion rates? Or is there good and bad friction?
Should users experience the value of your product as quickly as possible?
The vast majority of online resources will tell you: yes!
But our answer at InnerTrends is: yes, but there are four key areas we need to focus on:
-
Define your product’s value
Without a good definition, you’ll end up creating a process that isn’t going to deliver the results you expect. -
Focus on the friction that increases conversion
There is, in fact, such a thing as good and bad friction. Bad friction decreases conversion, while good friction increases conversion. So we want to understand and focus our efforts on eliminating bad friction, and creating good friction. -
Defining the “right” time for people to get to first value
It’s commonly believed that we should strive to create a frictionless or close to frictionless onboarding process for users to arrive at the value of a product as quickly as possible. But frictionless, or “fastest” isn’t always the most optimal. -
Higher retention is more important than faster onboarding
Should we aim for less friction and faster completion of the onboarding process first? Or understand the impact on retention first?
Define the product’s value
It all starts with a clear and basic promise: your website, landing pages, social media, ads, and newsletters all make a promise of value to your visitors.
Based on this promise, the visitor hopefully says: “Hey, this product seems interesting enough. I want to try it out.”
When your product’s promise meets visitors’ needs, that’s when they consider signing up, and go through the onboarding process.
So that promise is crucial to defining your product’s value, because that’s what people are looking for; they want to experience that promise.
There are two questions you should answer whenever you want to define that moment:
Q1. What is the promise you make to your users and customers?
Don’t overcomplicate this one – the big heading at the top of your homepage will tell you what your promise is. The answer is linked to your value proposition.
E.g. Create, edit and sign documents.
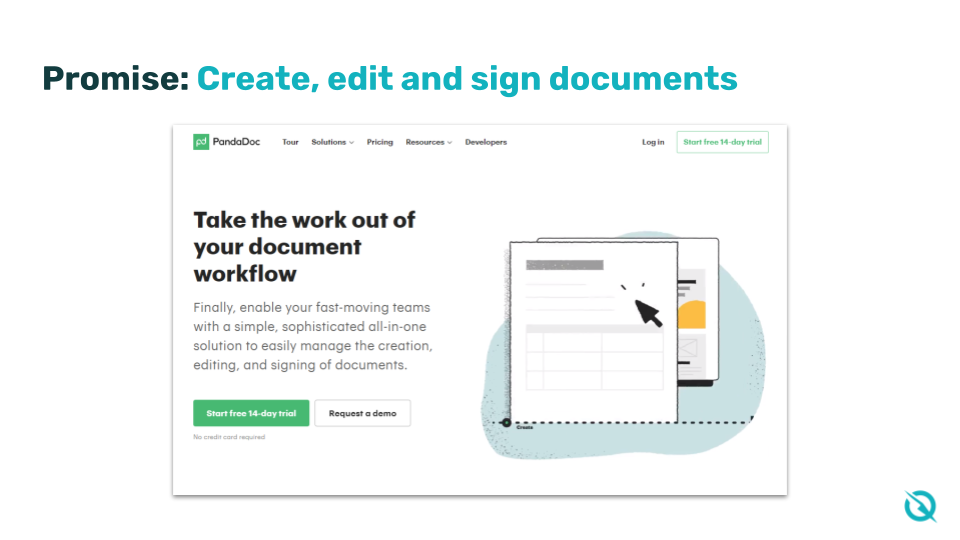
Example of product promise – PandaDoc
Q2. What’s the core functionality of your product that enables users to experience that promise?
What’s the most important item inside your product that makes it possible for users to experience that promise?
It’ll always be defined as a verb and a noun; it’s important to define it this way. Why? Because getting to the promise of your product is the best definition for the last step of the onboarding process.
Ex. Sign document.
What are the technical requirements for a user to experience your product’s promise?
In the process of getting from the moment the user signs up to the moment they experience the value of your product for the first time, there is going to be friction.
People need to complete actions to receive value from your product, and they’ll need to go through some technical requirements, which are your onboarding steps.
For example, for an accounting business a user would need to:
- Create an account
- Add the business’ details
- Scan an invoice
Without adding business details, scanning the invoice won’t necessarily make sense. What business is the invoice for? How can the product give your users value if it doesn’t know that?
When you look at it like this, your onboarding funnel will be linear and will lead to that action or core functionality that’s linked to that promise.
At this step you can analyze an onboarding funnel, which is now a linear process where users go through the technical requirements step by step to experience the value of your product.
This analysis is where you’ll discover your biggest opportunity for growth in the onboarding process, which will be the technical requirement where you’re losing the most accounts.
Identify the good friction
Now that we have a path through which users need to go through from signing up to experiencing your product’s value, it’s time to identify the good friction.
As previously stated, the technical requirement or onboarding step where you’re losing the most accounts is your biggest opportunity for growth. The challenge here is to analyze what’s happening when users arrive at this step that’s causing them to not reach the next step.
There are three types of activities we can categorize the user’s actions into, which will determine the type of friction caused:
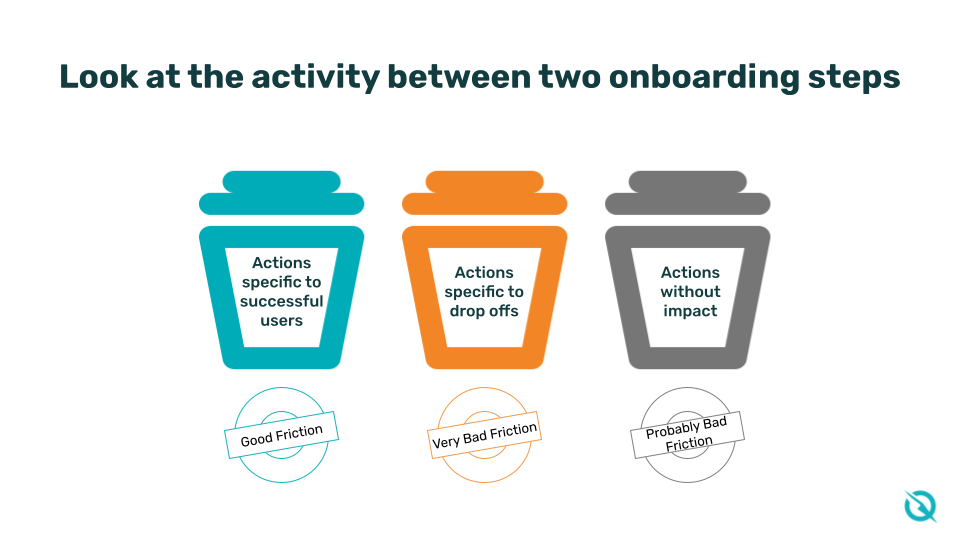
GOOD FRICTION: Actions specific to successful users
Good friction is caused by all of the actions that, if users complete, are more likely to finish the onboarding process. These are enablers. So we don’t want to eliminate friction; we want to introduce more enablers, or elements that our data indicates that if users were to complete, they would be more likely to finish the onboarding process.
VERY BAD FRICTION: Actions specific to drop offs
Users that dropped off were more likely to perform these actions than users that didn’t, causing very bad friction. It tells us that there are areas of our product where, if users arrive at this stage of the onboarding process, they’re more likely to abandon the product and leave. This is the kind of friction we want to eliminate.
PROBABLY BAD FRICTION: Actions without impact
It doesn’t matter if users perform these actions or not, the onboarding rate will remain the same. We still consider actions without impact to cause probably bad friction because if the action(s) don’t help, if they’re a waste of time for users to complete and don’t have an impact towards their current goal, it means they’re not really needed.
Measure Time to Value
We see a lot of companies do this incorrectly, and they all do it the same way. They look at all of the users that finished the onboarding process (in other words, arrived at the value) and average the time it took for these users to get there.
When analyzing data, an average is actually a really bad way to look at time. You need to start with a distribution. This is important because it won’t look like a normal distribution; it will look like a Pareto distribution.
It’s important to analyze this data as a Pareto distribution because a lot of users will have a common behavior, and then there will be a long tail of users that have an uncommon behavior. If we take an average of all of the users who finished the onboarding process, this will not help us optimize much.
Here’s an example:
Let’s say we have a publishing tool; 65% of users have a common behavior, and 35% of users will make up the long tail. Because we only take an average from the percentage of users with a common behavior, the time to finish onboarding (publish an article) is seven hours.
But then we have our outliers – the 35% of users who might take days, weeks or even months to finish the onboarding process and publish their first article.
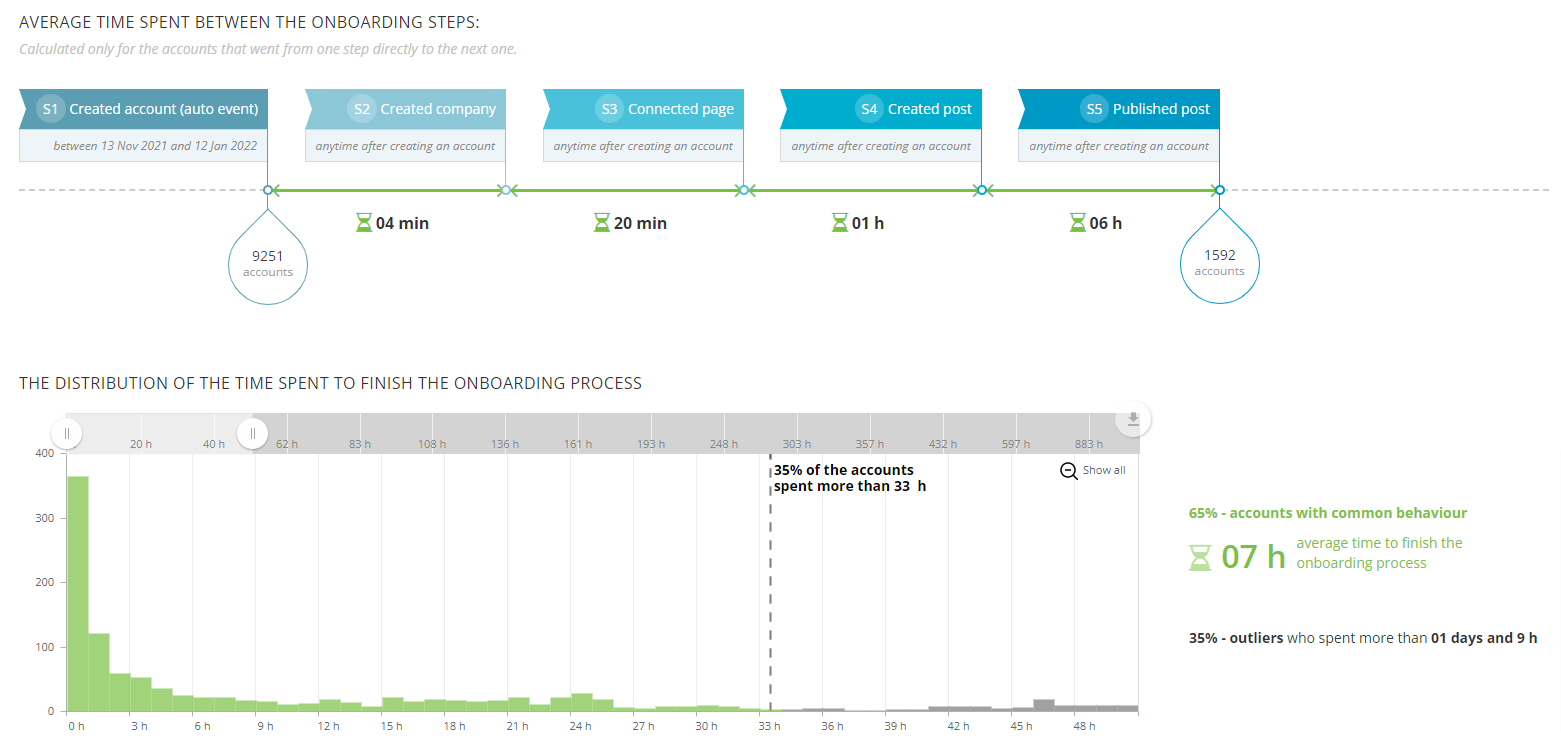
InnerTrends pre-built report: How long does it take to onboard new accounts?
So here’s the question we face: should we aim to get more users to perform the common behavior, and as few as possible to fall into the long tail of outliers?
Let’s find out.
Read on – or watch this video for a fast explanation :
Retention vs. Faster Onboarding
When we heard “get users to finish onboarding as quickly as possible,” we translated that into: “try to reach as high of a percentage of users with common behavior as possible.”
If that’s the case, we questioned: should there be a correlation to users that take longer to finish the onboarding process? Are they of less value for the business?
So we drilled down further to all of the users that took a much longer time to finish the onboarding process, as well as the outliers.
We created a behavioral segment of all the accounts that took a long time to onboard.
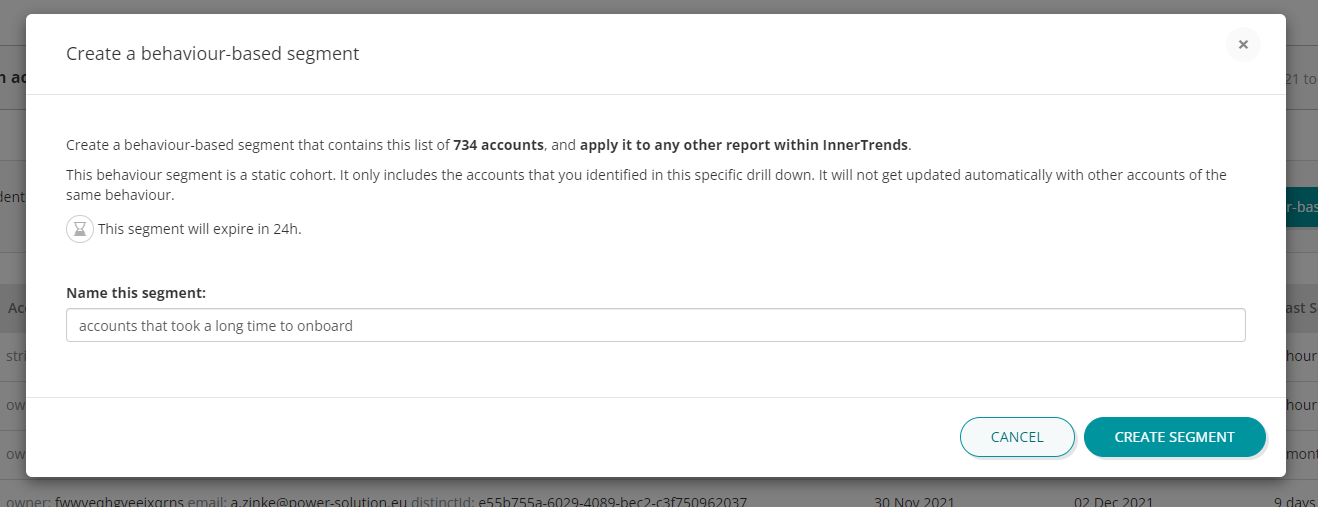
Creating a behavior-based segment with InnerTrends
Finally, we looked at the retention of users who finished the onboarding process:
- Users who take a long time to finish the onboarding process had a retention rate of 83% for the first week, and then it stabilized around 45% after two months.
- Users who finished the onboarding as quickly as possible (in less than seven hours) had a retention rate of 61% for the first week, and then it stabilized around 16-17% after two months. This is considerably lower than those who finished the onboarding over a longer time frame.
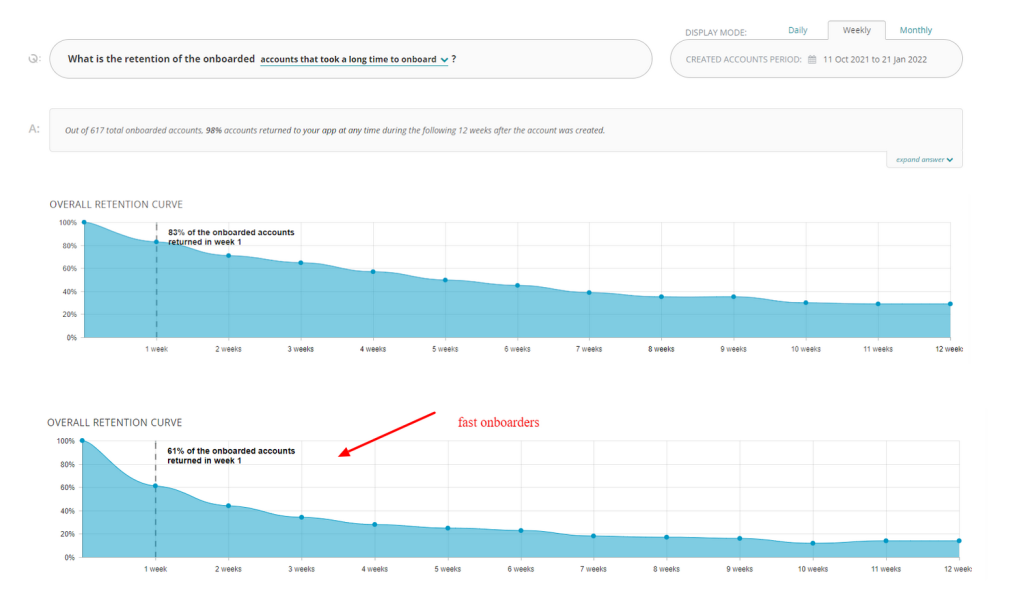
All of the accounts are onboarded; all of them experienced the value. The only difference between the two groups is that for some, it took longer to experience the value, while others arrived at the value very quickly.
We put this to the test with five other companies from different verticals, and saw the same pattern every single time. Users that took a long time to finish the onboarding process were also more likely to return.
But remember: this is correlation, not causation. So it’s not because they take longer to onboard that they have a higher retention; the two are correlated.
Don’t try to get users to spend more time during the onboarding process.
Instead, your key takeaway should be that there might be a reason that these users need a longer time to complete the onboarding process.
They might need approval, it might be a part of their specific process, they may be planning to use your tool at a set time when they know they’ll be ready to introduce it.
You should not try to rush these users into finishing onboarding as quickly as possible because as the data has shown, users who finish the onboarding process on their own terms will have a stronger retention. They are not just trying to discover your value as quickly as possible; they’re making your product a part of their internal process, and want to use your product for the long term.
Forcing users to finish the onboarding process as quickly as possible might lead you to lower growth results than what you may be expecting.
Onboarding Benchmarks
Here are some benchmarks that we use at InnerTrends to help you in the process:
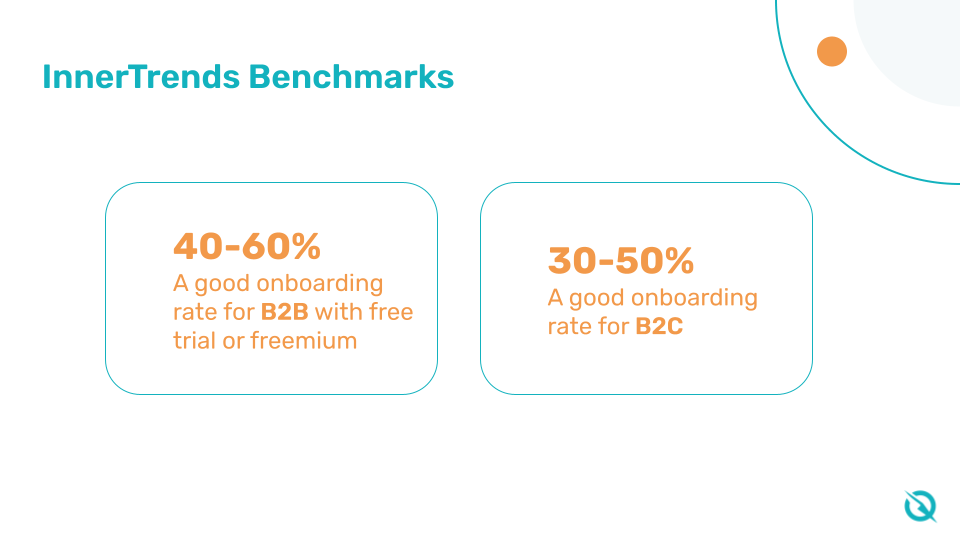
- A good onboarding rate for B2B free trial or freemium products is between 40-60%.
- Companies that tend to have a more complex signup process where they better qualify buyers manage to get this rate to more than 60-80%
- Companies that make it as easy as possible to sign up will have onboarding rates of 40% or lower.
- A good onboarding rate for B2C products is between 30-50%.
- The onboarding process often takes hours or days while upgrading takes days or weeks.
To dive even further into the use of friction for customer retention, be sure to watch this webinar hosted by our friends at Verifone – including an extensive question and answer section with our listeners at the end

Comment below: have you seen good or bad friction in your onboarding process? We look forward to hearing from you.