Time
Take any web analytics tool for a sprint around the block and you’ll quickly discover how crucial time is.
Every single report we look at fits into a time frame. Without it, the numbers shown tell us nothing. Don’t believe me? Have a look at what happens to the data if we hide time from a chart:
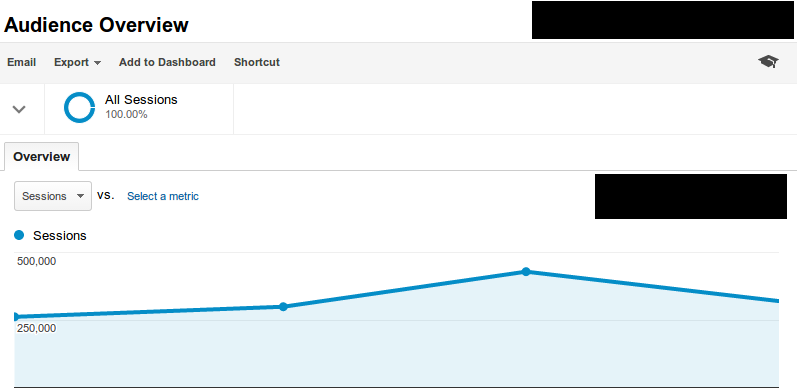 How much traffic does the above website have? Is it daily, weekly or monthly data?
Adding the date to the graph will give you a quick snap shot view of the size of the website and shows a slight increase over time but how do you know if the business is growing?
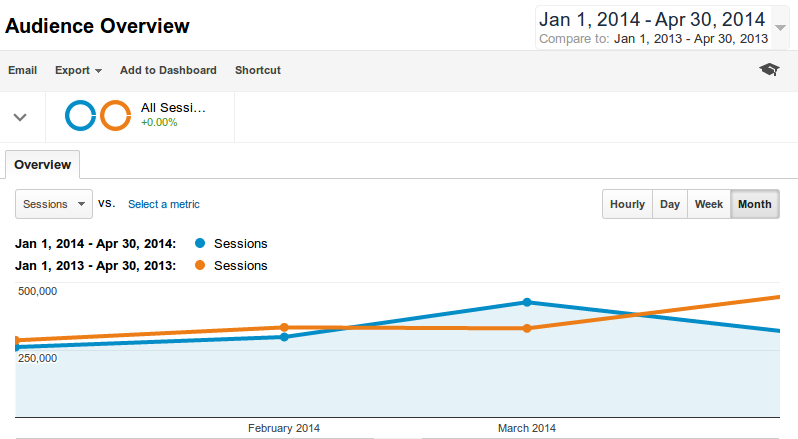
Comparing dates can usually help answer this question. Here is how the graph looks when we add in the same period from last year:
Tip
Make sure that you always compare like with like. Comparing a Tuesday from 2014 with a Sunday from 2013 will probably show an increase in sales but that might be totally misleading. Comparing over longer time frames or comparing a Tuesday in 2014 with a Tuesday in 2013 is much more accurate.
Ok, so business has shown an increase compared to last year, but how much of the business from last year is responsible for today’s sales and how much of today’s bottom line is new business.
Here is where most web analytics tools don’t deliver but there are some exceptions: Tools that have implemented what is called “cohort analysis”. (There are rumors that Google Analytics will make this available in the near future.)
Cohort is one of those complex and abstract terms that scare many non-technical decisions makers.
Although “cohort” is one of those complex and abstract terms that can scare many non-technical decisions makers, a cohort is simply a group of people. We probably just call it a cohort to sound smart! A “cohort analysis” describes how a group or segment of your visitors has performed over time.
What does it have to do with time? Good question … everything! Cohort analysis allows you to answer questions like: Between Week 1 and Week 4, how often did the people that created an account in Week 1 logged in the app?
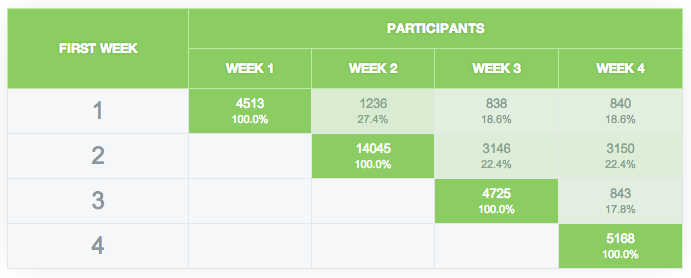
Here is how GetSmartify explains the above report: “The first cell shows the number of participants that participated in a specific week, and the following cells show how many of them returned to the promotion in subsequent weeks.“
The final frontier of using time in web analytics is to be able to attach a time attribute to every segmentation rule when analyzing data. For example, “All visitors that came from AdWords in May, purchased more than once by June and did not visit the website again.” Now that’s what targeted email marketing looks like!
Wouldn’t it be great to identify exactly which action makes the difference between a performing group of people and an under-performing one?
So that’s how time affects data but how about understanding the impact of what people do when they visit a website? That’s where context comes into play.
Context
Every single thing we do happens within the context of what is going on around us. Every image on our website, every piece of copy and even the way a website looks is going to impact how people behave.
Of course, there is no way to force a user to behave in a certain way. All we can do is to offer him the context that lures or persuades him to behave in a certain way; the way that proves most profitable to us and the user.
However, what most web analytics tools do is show us the URL of the pages that a visitor has been on. Being an abstract thing, the URL is not easy to relate to and analyse.
We are yet to see a significant business decision taken solely on the URLs visited by a website audience. That data can be used to try and validate or invalidate ideas of optimization, but it is almost never useful by itself.
Web analytics tools know this and they are starting to give users the option of tracking context as well. Here is an example of a report that focuses on context:
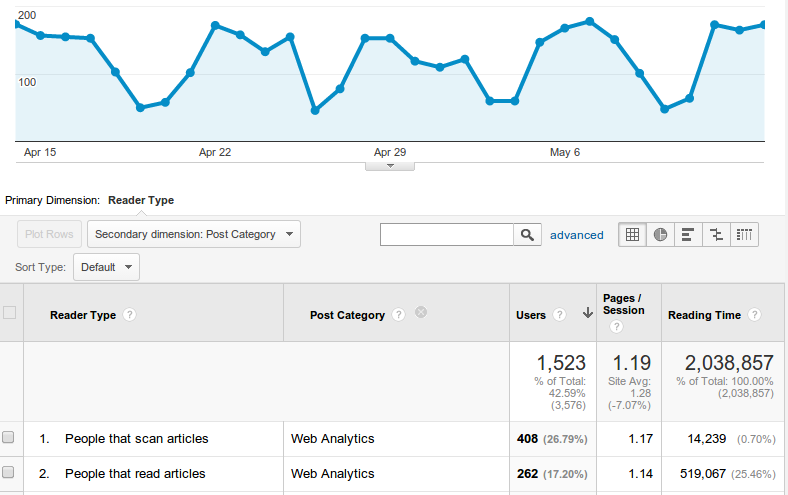
But context isn’t only about what happens on a website. It’s about everything that you do, online and offline, and touches the people that you want to become customers, your audience.
While web analytics tools are great at linking revenue with traffic sources, they are not so great at linking charge backs with marketing channels, nor the impact of your support team on sales, nor how well your product works with prolonging the lifetime of a customer.
Some of these actions are very difficult to implement and often with prohibitive costs, but make no mistake about it: it’s context that drives sales, not page URLs. It’s context that allows you to optimize your website based on data instead of intuition.
Ultimate round
Put time and context together and web analytics has never looked easier or more efficient.
The most difficult part of making time and context your friend is for your web analytics tool to recognise when a person is the same one, no matter when he is visiting your website and from what device.
That’s no easy task for most websites but for web and mobile applications and for any website where a person must log in, this can be achieved with with very little cost. Even Google Analytics makes this easy now.
Here at Inner Trends, we’re building the ultimate solution for mobile and web applications. We call it the log book and it is the perfect solution for bringing time and context together in perfect harmony.
Looking for deep insights into how your customers use your product?
InnerTrends can help. You won’t have to be a data scientist to discover the best growth opportunities for your business, our software will take care of that for you.
Schedule a Demo with us and witness with your own eyes just how powerful InnerTrends can be.