Did you know that up to 80% of the people that churn are customers with low or no engagement. Such numbers can break your business if you don’t address the issue accordingly.
Customer retention has become a must for the profitability of your business, especially since the costs of acquisition have been on the rise lately.
Now, customer retention is closely linked to the engagement levels of your users, which, in turn, can be used to predict the churn risk.
Read on, and find out how to interpret engagement levels and how to use them to predict churn. You can also watch the webinar I held last week on the topic. For the full webinar click here. Our thanks go to 2checkout for kindly hosting it.
Bottom line – how can you improve retention?
First, let me just say that there is a misconception among many companies I worked with, who believe that churn prediction and engagement scoring work only for large companies. In our experience, all companies, whatever the size, can benefit from these figures.

Understand how user engagement works and you will significantly reduce churn, and thus improve retention and increase revenue.
Basically, the rule is:
When engagement goes UP churn goes DOWN.
So, if you learn how to increase engagement, your users’ churn risk will decrease.
What can you do to increase engagement and reduce churn?
To make things easy, we’ve split this process in 4 steps, and we’ve taken into consideration a period of 30 days:
1. First, you need to score your customers’ engagement.
The customer engagement score is used to rank all users and is calculated taking into account the following 3 ingredients:
- Frequency
- Recency
- Engagement Points
After you finish the ranking of your customers, you will have a clear perspective on the engagement level of your users which will look something like this:
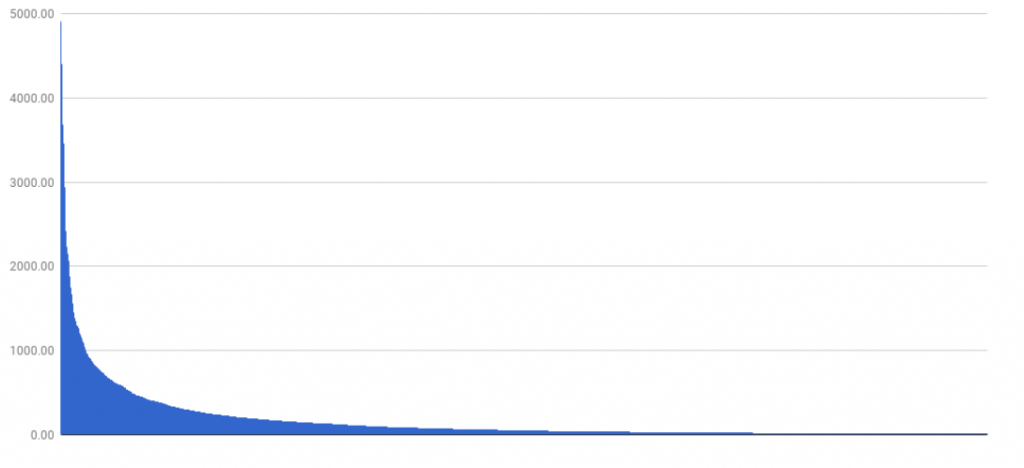
Ranking customers based on engagement
2. Now that you have this statistic, you have to define the 4 user engagement categories (high, medium, low and no-engagement users). Basically, you need to determine where one category starts and where it finishes. Your graph will look more or less like this:
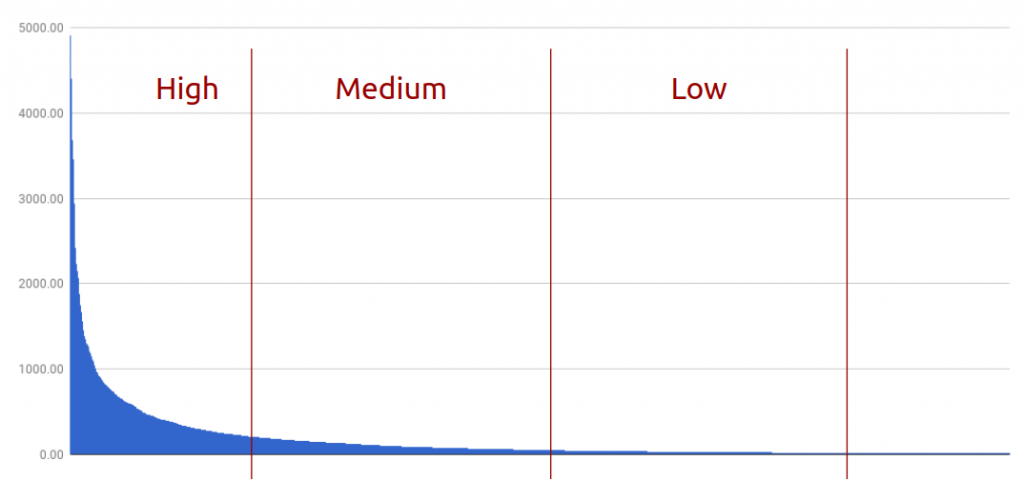
Customer engagement categories
To calculate the boundaries of these categories, the secret lies in starting from the engagement scores of customers who churned in a specific period of time. You have to determine the highest score of a person who churned.
- No engagement users are those who had no engagement actions during the last 30 days, though they used your app.
- To find out who your low engagement users are, eliminate outliers from the churned users (the atypical users). Basically, all the people who have a similar score to those who churned in the past will be part of your low engagement users.
- After eliminating your low and no engagement users you are left with your high and medium engagement users.
- Repeat the same process. Eliminate the atypical users, and you will have your high engagement ones.
- And then you are left with the medium engagement users.
3. Then, calculate the churn risk for each category.
To calculate the risk for each category, you need to:
- Select a period previous to 30 days ago
- Identify all the active customers from that period and the ones that churned.
- Identify the engagement category of each customer
- Calculate churn risk per category
For instance, to calculate the churn risk for high engagement customers use the following formula:
Churn Risk = Churned High Engagement Users / Active High Engagement Users
4. Decrease churn by targeting customers based on their engagement level changes.
The next step is to determine when users move from one category to another. And, believe me, they move a lot!
For instance for a company with 300 active users / month, about 10 of them will change category every day. For companies with thousands or tens of thousands of users, you can expect tens or even hundreds of users to change their engagement level every single day.
You definitely want to monitor the decreasing engagement scores, because someone who goes from high to medium and then to low engagement will have a very high churn risk. But, because they are still active, you can still interact with them, you don’t need to recover them after they left. The best thing to do is to find out the problem and fix it, and thus prevent them from leaving.
If you are interested in more details about Engagement Scoring & Churn Prediction, don’t forget to check out the webinar from last week. It focused on how to:
- Segment users based on their engagement and churn patterns
- Calculate and use an engagement score
- Identify the users who are most likely to churn in the near future
- Automate churn reduction campaigns triggered by changes in user engagement
- Identify the minimum set of actions required to decrease a user’s churn risk
- Find out who your most engaged customers are and the ideal time to ask them for reviews or recommendations
Looking to get deep insights into how your customers use your product? InnerTrends can help. You won’t have to be a data scientist to discover the best growth opportunities for your business, our software will take care of that for you.
Schedule a Demo with us and witness with your own eyes just how powerful InnerTrends can be.